- Subscribe to RSS Feed
- Mark Topic as New
- Mark Topic as Read
- Float this Topic for Current User
- Bookmark
- Subscribe
- Mute
- Printer Friendly Page
Debugging DCAF Applications
10-20-2017 04:38 PM - edited 10-20-2017 04:52 PM
- Mark as New
- Bookmark
- Subscribe
- Mute
- Subscribe to RSS Feed
- Permalink
- Report to a Moderator
While developing in LabVIEW, one of the primary debugging tools is to probe data wires to view the current value of various pieces of data in the code. This becomes challenging when using a large, feature-rich framework like DCAF, particularly when working with shared reentrant code deployed on a real-time embedded target. While DCAF is fully open-sourced, it can still be quite challenging to drill down through the framework to probe the wire that you want.
DCAF provides several capabilities to simplify debugging deployed systems.
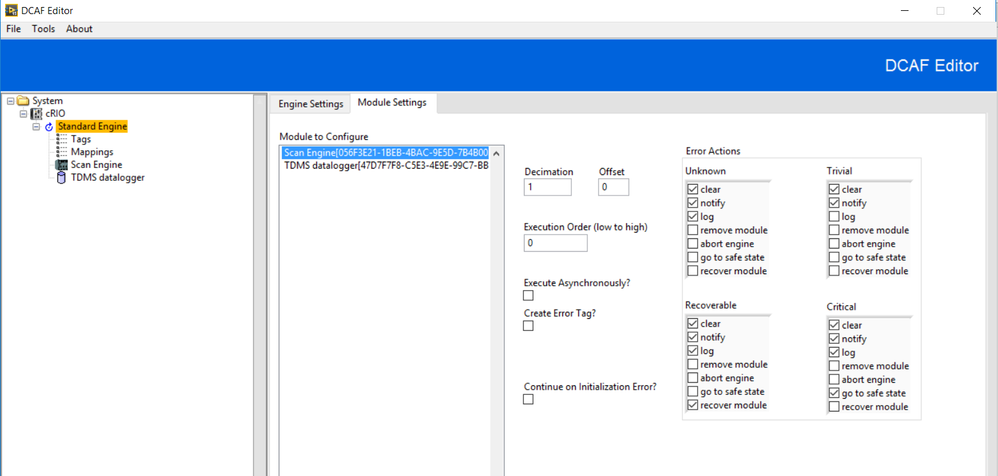
The first is a robust error handling system that captures and logs any error reported by any module in the system.
You can customize the error handling at two levels. Each module can filter its errors and classify them to the engine as trivial, recoverable, or critical severity. A module may also clear errors that are safe to ignore. In the engine configuration, you can choose what to do with errors that are reported to the engine. By default, all errors detected by the framework are logged to the system log, with the same information you would see in the regular error dialog in LabVIEW. You can also choose to disable the module, attempt to recover the module by closing and reinitializing it, or putting IO in a safe state and aborting the engine.

The system log can be viewed as a file on the local disk, or via the built-in web interface.

Please see DCAF Event Logging With Syslog for more information on the error and event logging subsystem.
Error management is very useful for identifying runtime errors, but it is not useful for identifying incorrect logic that is able to run, but produces a result that you did not intend. In these cases, you must know a bit more about what you're looking for.
When developing code intended to be plugged into a framework like DCAF, it is a best practice to validate your code at the unit level before attempting to integrate it into a larger system. If you are trying to determine why a custom code module is misbehaving, it is useful to first validate that the runtime VIs perform as expected when called outside the context of the framework.
The Dynamic Channel Module project template will script out a series of unit tests that can be used to validate that your code can plug into the framework correctly. You can extend these with additional functional tests for your custom logic. If you have the LabVIEW Unit Test Framework, you can easily create unit test definitions to simplify the execution and validation of the tests. You can see an example of this in the pre-built modules available on LabVIEW Tools Network, such as the DDS module.

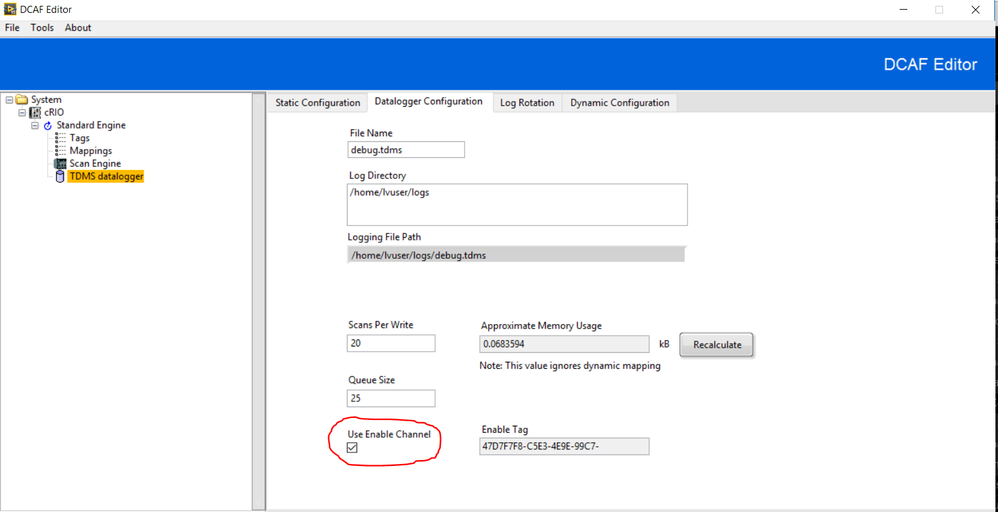
A powerful technique to debug runtime behavior of code modules in DCAF is to include a TDMS datalogger module in your configuration. This can give you lossless or decimated time-series data of how tags in your system change iteration to iteration of the main control loop. You can choose to log all tags, or just the tags associated with a particular module whose behavior you are investigating.
To prevent unnecessary wear on the disk (as well as reduced application performance), you can disable the log unless an enable tag is set to TRUE. You can map this enable tag to a button on an HMI, to the USER1 push button on the FPGA (such that logging only happens while the button is pressed), or to any other data source in the system. Adding this into your configuration is a simple and effective way to gain insight into what is happening on the deployed system.

Note that this approach can only show you what data is flowing between modules, not what is happening inside a particular module.
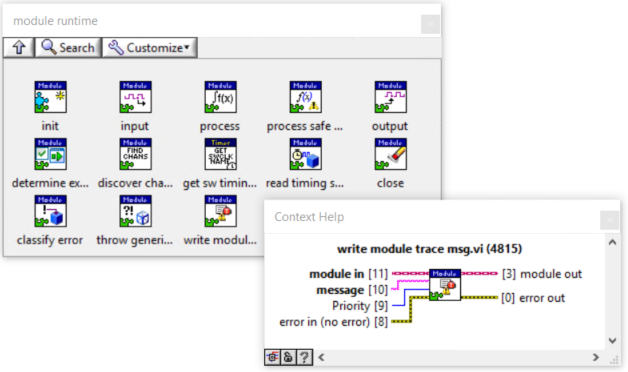
To gain more insight into what is happening inside a particular code module, you can edit the code module (even ones from LabVIEW Tools Network) to include debug trace messages of your choosing. In this way, you will be able to see timestamped event log data (in the same log stream as the error reports) from any modules in the system you wish to investigate. This is particularly useful for detecting state transitions within a code module at runtime.

If these methods are still not sufficient to identify the issue, you can also edit a code module's runtime code to include a non-reentrant subVI, and pass the data you wish to inspect at runtime to that VI's connector pane. You can then easily open that non-reentrant VI from your project to see the live data inside that module. Note that this method is only effective if there is a single instance of the module you are trying to debug.
We are also working on a live tag viewer web interface, and would love to hear your ideas on how to improve debugging in DCAF. Let us know what would help!
Matt Pollock
National Instruments
