- Subscribe to RSS Feed
- Mark Topic as New
- Mark Topic as Read
- Float this Topic for Current User
- Bookmark
- Subscribe
- Mute
- Printer Friendly Page
Build/ assign value to array elements
Solved!11-20-2012 11:23 PM
- Mark as New
- Bookmark
- Subscribe
- Mute
- Subscribe to RSS Feed
- Permalink
- Report to a Moderator
I have an array of size 600 by 600 pixels. In a circle of given radius (say 50 pixels) and given origin (given ith row and jth column), I want to plot gaussian distribution, i.e., give the pixels
the value of a 2-D gaussian distribution with peak at the origin. How do I do this in labview ?
Thanks.
Solved! Go to Solution.
- Tags:
- array
11-21-2012 12:57 AM
- Mark as New
- Bookmark
- Subscribe
- Mute
- Subscribe to RSS Feed
- Permalink
- Report to a Moderator
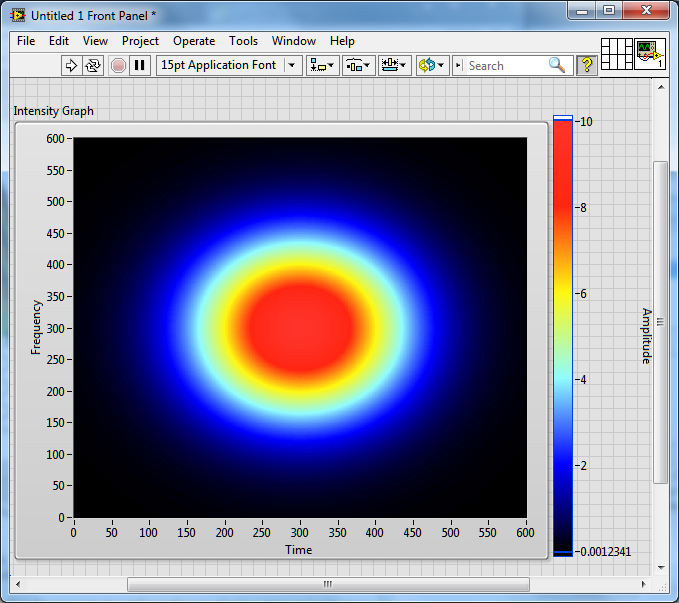
You would run your x and y values through the 2D Gaussian function but making the origin 300,300 (for your given 600x600 pixel array). Here's what I get on an intensity chart given an amplitude of 10 and sigma = 100 pixels:
Here's the example (quick and dirty) code:
11-21-2012 07:35 AM - edited 11-21-2012 07:48 AM
- Mark as New
- Bookmark
- Subscribe
- Mute
- Subscribe to RSS Feed
- Permalink
- Report to a Moderator
--
11-21-2012 07:48 AM - edited 11-21-2012 07:53 AM
- Mark as New
- Bookmark
- Subscribe
- Mute
- Subscribe to RSS Feed
- Permalink
- Report to a Moderator
Thanks for your reply.
How do I convert this intensity distribution into a greyscale (uint8) image (a matrix with all elements between 0 and 255) ?
I used "To Unsigned Byte Integer" function but it doesn't seem to solve the problem ?
11-21-2012 02:09 PM
- Mark as New
- Bookmark
- Subscribe
- Mute
- Subscribe to RSS Feed
- Permalink
- Report to a Moderator
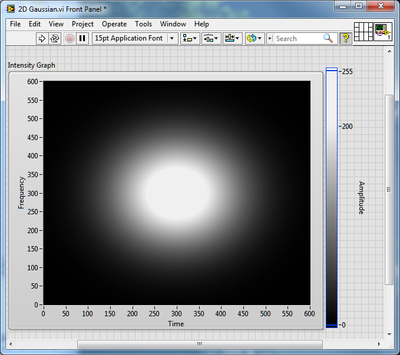
Just change the amplitude on the output of the exponential to 255 (instead of the 10 in my code example) and then convert to U8. Like this (after changing the marker colors in the intensity chart):
11-22-2012 12:27 AM
- Mark as New
- Bookmark
- Subscribe
- Mute
- Subscribe to RSS Feed
- Permalink
- Report to a Moderator
I tried to follow your hints but didn't succeed. May be I'm missing something silly.
Attached is my program. Please change it to obtain the desired pattern.
Thanks.
11-22-2012 12:57 AM
- Mark as New
- Bookmark
- Subscribe
- Mute
- Subscribe to RSS Feed
- Permalink
- Report to a Moderator
You used the wrong exponential...Use "exp(x)" instead of "exp(x) - 1".
11-22-2012 01:07 AM
- Mark as New
- Bookmark
- Subscribe
- Mute
- Subscribe to RSS Feed
- Permalink
- Report to a Moderator
Thank you for pointing out the mistake.
It works.
Regards.
11-22-2012 01:08 AM - edited 11-22-2012 01:39 AM
- Mark as New
- Bookmark
- Subscribe
- Mute
- Subscribe to RSS Feed
- Permalink
- Report to a Moderator
Here's a one-loop version. It is sufficient to calculate a singe 1D gaussan once, then use the outer product to generate the 2D array.
This means we only need to evaluate only 600 exponential functions instead of 360000! 😄 (You could reduce it again by 50% taking advantage of symmetry. Try it!)
(see also)

11-22-2012 02:18 AM
- Mark as New
- Bookmark
- Subscribe
- Mute
- Subscribe to RSS Feed
- Permalink
- Report to a Moderator
Thanks.
It's definitely a better approach.
Regards.


