- Subscribe to RSS Feed
- Mark Topic as New
- Mark Topic as Read
- Float this Topic for Current User
- Bookmark
- Subscribe
- Mute
- Printer Friendly Page
DETT - navigate to call chain VIs opens in RT target
02-11-2015 03:11 PM
- Mark as New
- Bookmark
- Subscribe
- Mute
- Subscribe to RSS Feed
- Permalink
- Report to a Moderator
Minor annoyance here. Have spent a little bit of time the last couple of days tracking down reference leaks in an application.
Naturally, the Desktop Execution Trace Toolkit is the weapon of choice here. Running a trace and running the main VI in the development environment has allowed me to track down the reference leaks, but I find it odd that right clicking on one of the entries and selecting a VI in Navigate to Call Chain VIs always opens the calling VI in my real time target...even if it's not used there.
Can I change the default 'target' on which to open it when selecting this? Most of the VIs involved have never even been introduced to the RT target, let alone being run there at the time.
A minor annoyance, but an annoyance all the same!
CLA
02-18-2015 07:11 AM
- Mark as New
- Bookmark
- Subscribe
- Mute
- Subscribe to RSS Feed
- Permalink
- Report to a Moderator
Hi thoult,
When you right click and go to Navigate to Call Chains VI, what VIs are shown? Is it named after the VI that you are running?
Also at the top of the LabVIEW Desktop Execution Trace Toolkit, is it running on the localhost?
Applications Engineer
National Instruments
02-18-2015 07:26 AM - edited 02-18-2015 07:30 AM
- Mark as New
- Bookmark
- Subscribe
- Mute
- Subscribe to RSS Feed
- Permalink
- Report to a Moderator
Running on localhost, within the application instance for the particular project I'm running.
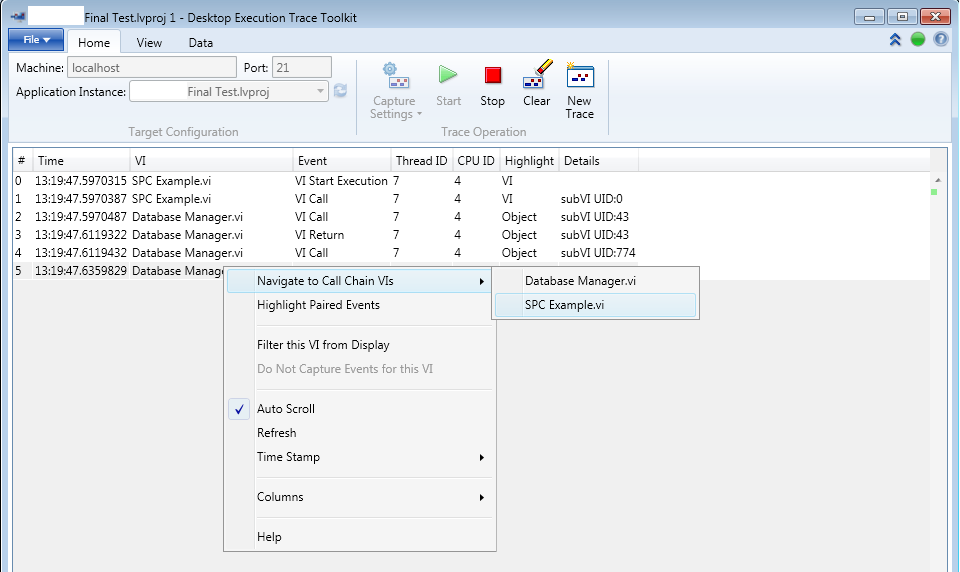
Here's a screen of a DETT session window for a VI (SPC Example.vi, which calls the Database Manager VI) that has never been run on the RT or FPGA, just in the development environment on the PC:
Right clicking through the call chain to Database Manager.vi, it's opened on the FPGA Target rather than the main project where it's called...despite neither being used there nor supported on that target:
Odd!
Edit - last week, some VIs I checked via Navigate to Call Chain open them under the RT target, when again they aren't deployed there.
CLA
02-18-2015 09:04 AM
- Mark as New
- Bookmark
- Subscribe
- Mute
- Subscribe to RSS Feed
- Permalink
- Report to a Moderator
Hi thoult,
That is rather strange. Would it be possible for you to explain what you are trying to achieve in this VI?
Applications Engineer
National Instruments
02-18-2015 09:13 AM
- Mark as New
- Bookmark
- Subscribe
- Mute
- Subscribe to RSS Feed
- Permalink
- Report to a Moderator
Well, that Vi was just chosen as an exemplar for the behaviour. It's a simple SQL database call and then some data processing using SPC VIs from the DSC module. As you can imagine, none of that happens anywhere near the FPGA level, so no idea why DETT is opening the call chain as if it were.
I use DETT for tracking down memory/reference leaks in top level VIs, so there's usually a whole heap of things happening in them.
CLA
02-18-2015 09:52 AM
- Mark as New
- Bookmark
- Subscribe
- Mute
- Subscribe to RSS Feed
- Permalink
- Report to a Moderator
Hi thoult,
My next step would be to reinstall the LabVIEW Desktop Execution Trace Toolkit.
Have you tried this yet?
Applications Engineer
National Instruments
03-10-2015 07:07 AM
- Mark as New
- Bookmark
- Subscribe
- Mute
- Subscribe to RSS Feed
- Permalink
- Report to a Moderator
Just getting back to this.
Fresh install of LV2013 and DETT, brand spanking new project, first time I run DETT and try to open the call chain for a VI...
Following the call chain magically opens them on the FPGA target:
CLA
03-11-2015 04:55 AM
- Mark as New
- Bookmark
- Subscribe
- Mute
- Subscribe to RSS Feed
- Permalink
- Report to a Moderator
Hi thoult,
Does this happen for every VI that you run? Can you run a very simple DAQmx VI, and will DETT navigate to the correct VI under the correct target?
What versions of LabVIEW and DETT are you running?
Applications Engineer
National Instruments
03-11-2015 09:56 AM
- Mark as New
- Bookmark
- Subscribe
- Mute
- Subscribe to RSS Feed
- Permalink
- Report to a Moderator
LV 13.0.1 (SP1)
DETT for Labview 2013
Seemingly any VI for which I try to open via the call chain context menu will open under the FPGA target, regardless of what's in it.
CLA


