- Subscribe to RSS Feed
- Mark Topic as New
- Mark Topic as Read
- Float this Topic for Current User
- Bookmark
- Subscribe
- Mute
- Printer Friendly Page
- « Previous
-
- 1
- 2
- Next »
Memory Leak Detection Desktop Execution Trace Toolkit
10-06-2014 10:16 AM
- Mark as New
- Bookmark
- Subscribe
- Mute
- Subscribe to RSS Feed
- Permalink
- Report to a Moderator
@Yamaeda wrote:
@rolfk wrote:
Some programmers believe it is proper to do a complete cleanup before exciting the process, others trust that the OS will do a better job at this than they ever could. Personally I tend to believe that the latter a pretty lazy programmers.
I dont know if the system is alot better, but it's alot faster to ditch LV that close all correctly. ;D/Y
Yeah! That is because the OS frees memory in whole pages, while LabVIEW has to walk its memory allocations and free every pointer individually. That is the main speedup of letting the OS take care of this business.
11-23-2015 07:41 PM - edited 11-23-2015 07:44 PM
- Mark as New
- Bookmark
- Subscribe
- Mute
- Subscribe to RSS Feed
- Permalink
- Report to a Moderator
Hi,
I've used the Execution Trace Toolkit to monitor the memory usage of my application, as my application has crashed several times when it has continuously ran for a long period of time.
A key part of my application is to constantly acquire images in a loop and process them in a seperate loop. I'm using a queue to pass images between the loops. After tidying up the code and removed the obvious mistakes that caused memory reallocation, such as using a build array function in a for loop, the application is running a lot better now.
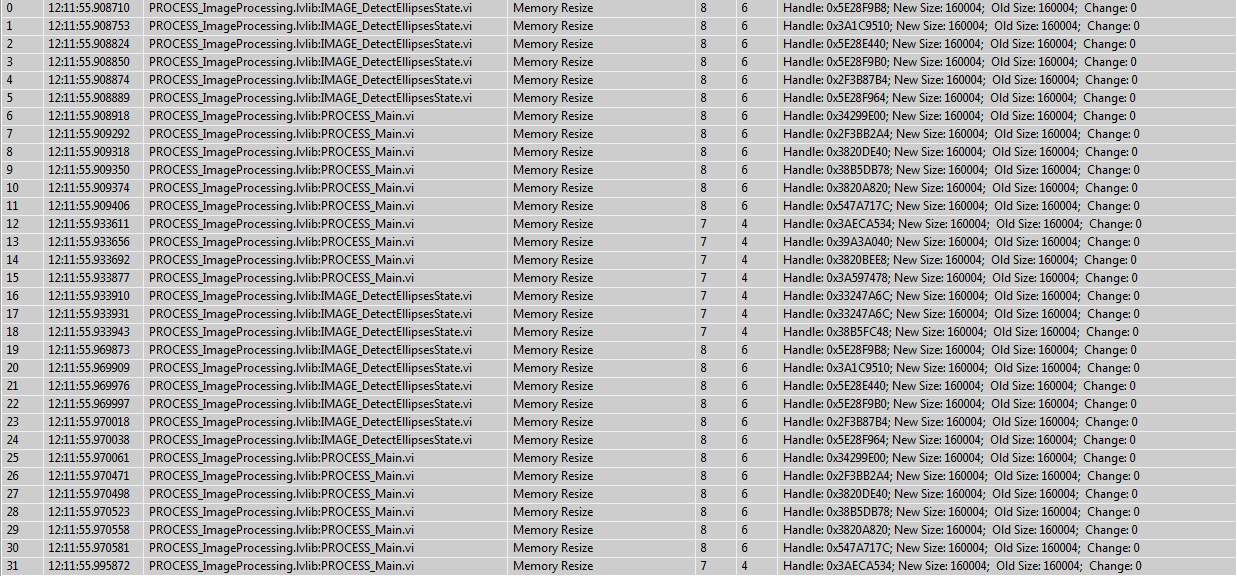
However, I'm still getting a bunch of the"Memory Resize" events as shown in the screenshot below.
Although the memory change is stated as 0, but it has several different handles.
I would like to know if this is OK, or is it contributing to the crash of my application after a long run?
Thanks in advance.
Jimmy
- « Previous
-
- 1
- 2
- Next »


