- Subscribe to RSS Feed
- Mark Topic as New
- Mark Topic as Read
- Float this Topic for Current User
- Bookmark
- Subscribe
- Mute
- Printer Friendly Page
- « Previous
-
- 1
- 2
- Next »
TCP/IP Fail
02-02-2018 10:16 AM
- Mark as New
- Bookmark
- Subscribe
- Mute
- Subscribe to RSS Feed
- Permalink
- Report to a Moderator
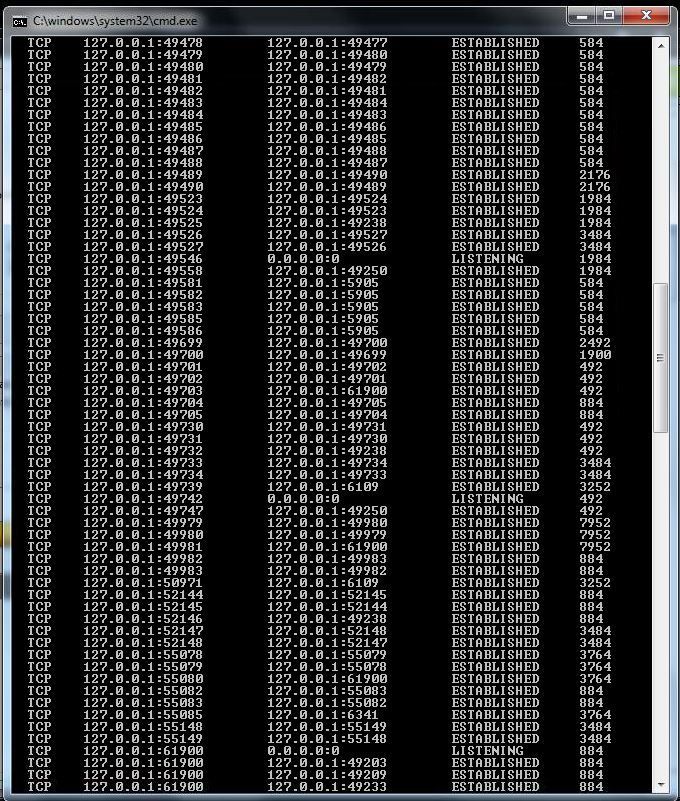
I typed C:\Windows\System32\netstat -ano to the command window. It shows a lot of entries for 127.0.0.1 (see image below), my TCP Open Connection VI has "localhost" as the input. The Instrument that's not communicating is IP 192.168.1.201, it's on a dedicated network card.
Any ideas on what to look at next. Is the localhost connection normal? why all the entries. TCP Create Listener has port number 6341 as an input, all other inputs are left disconnected (apart from error in/out).
02-02-2018 10:57 AM
- Mark as New
- Bookmark
- Subscribe
- Mute
- Subscribe to RSS Feed
- Permalink
- Report to a Moderator
That looks fairly typical for a Windows machine. You can look in the task manager to see what those processes are. I have a very similar result on my computer and I don't have any of my own applications doing anything on the network at the moment.
Mark Yedinak
Certified LabVIEW Architect
LabVIEW Champion
"Does anyone know where the love of God goes when the waves turn the minutes to hours?"
Wreck of the Edmund Fitzgerald - Gordon Lightfoot
02-02-2018 12:15 PM
- Mark as New
- Bookmark
- Subscribe
- Mute
- Subscribe to RSS Feed
- Permalink
- Report to a Moderator
Start up your cmd shell with admin rights and then add the -b switch to the netstat command. This prints the process name instead of only the PID so you easily can see if any of those localhost IP connections is from your application.
02-05-2018 04:30 AM
- Mark as New
- Bookmark
- Subscribe
- Mute
- Subscribe to RSS Feed
- Permalink
- Report to a Moderator
Thanks Rolf, I tried out netstat -b to get the ownership information. Data attached in .txt file.
My LabVIEW app is called RigOSv2.exe, my Logger is called Logger.exe. Logger is the server, RigOSv2 the client, port 6341.
The comms issue is with an instrument with IP 192.168.0.201, this has it's own network card.
You will notice that others on the LAN are able to establish a connection with the PC, the PC is running a manufacturing process, the design engineers want to access the rig output files to observe information generated during processes that occurred in the past.
Every 2 or 3 days, RigOSv2 hangs because of the comms fail with the instrument on 192.168.0.201. When I try to open the supplier software to talk to the instrument, I get windows error "A fatal error has occurred: An operation on a socket could not be performed because the system lacked sufficient buffer space or because a queue was full".
I have 7 machines running the same setup, so far only 1 has this issue. The build of software and config of each machine should be the same.
I don't know if the issue is connected to my Logger/Server, or if it's related to something else.
From reading up online about the Windows error, many have said that lots of TIME_OUT appearing the netstat results is bad, and may be causing the machine to run out of addressable TCP/IP connections.
Does the netstat information give me any more clues ?
02-15-2018 09:29 AM
- Mark as New
- Bookmark
- Subscribe
- Mute
- Subscribe to RSS Feed
- Permalink
- Report to a Moderator
The same issue has now occurred on another machine.
When the freeze happened, I ran "netstat -a" and saved the results to file.
When I tried to open the front end of the instrument on 192.168.1.201, I got the same Fatal Error Windows dialog.
I then closed the server application I created in LabVIEW, I was then able to open the front end of the instrument on 192.168.1.201.
This suggests my Server application is the issue. I repeated the netstat -a afterwards. Both netstat results are in the attached text file. The second netstat returned a different range of 127.0.0.1 ports.
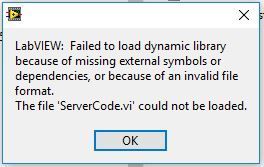
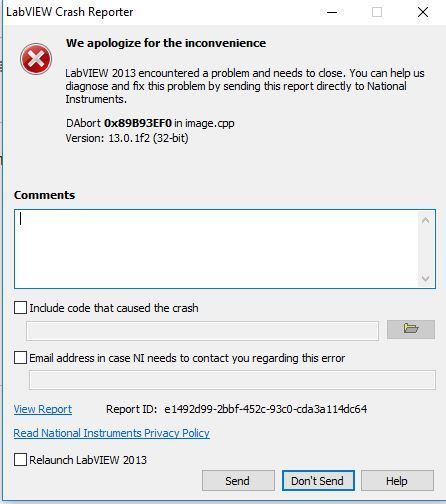
I want to attach my LabVIEW server code, but when I disconnect all the type defs, I get this error opening the single VI I want to post:
when I try save to hierarchy, i get this error. But it does complete the save, maybe incomplete. I can't post that whole lot here as not permitted by employer, but could ftp to NI.
- « Previous
-
- 1
- 2
- Next »


