- Subscribe to RSS Feed
- Mark Topic as New
- Mark Topic as Read
- Float this Topic for Current User
- Bookmark
- Subscribe
- Mute
- Printer Friendly Page
exe building makes small file
03-09-2023 11:03 AM - edited 03-09-2023 11:37 AM
- Mark as New
- Bookmark
- Subscribe
- Mute
- Subscribe to RSS Feed
- Permalink
- Report to a Moderator
I nabbed the zip file just by watching and waiting for the last step in the compilation, then copy-pasting that zip somewhere else. To my knowledge we don't have any third party antivirus, just the standard windows defender. I wonder if there's any way to have labview skip all the other steps and just try to do the last step with the zip file (doubt it as it wouldn't have all the classes and vis loaded into memory). Also, while it does appear to be random, it seems to happen more frequently the more classes are involved in the project. We've had this problem before, but after about 5-10 builds it eventually works, however we've done about 50 build and still no dice.
03-09-2023 11:46 AM
- Mark as New
- Bookmark
- Subscribe
- Mute
- Subscribe to RSS Feed
- Permalink
- Report to a Moderator
A timeout?
03-09-2023 11:48 AM - edited 03-09-2023 12:11 PM
- Mark as New
- Bookmark
- Subscribe
- Mute
- Subscribe to RSS Feed
- Permalink
- Report to a Moderator
There is an app builder API, so some steps can be executed individually.
Never needed it, but worth a look.
Looking at that code (not all pw protected) makes me think it might make a difference if you do a preview before the build. I don't think so, or expect it, but I would try it.
03-10-2023 02:37 AM
- Mark as New
- Bookmark
- Subscribe
- Mute
- Subscribe to RSS Feed
- Permalink
- Report to a Moderator
All systems use the same AV.
I don't suspect a timeout because there seems to be one system that builds successfully more often than the others, and it is the slowest machine.
Here's how the build process bar behaves for our project:
1. Empty for a while
2. Progresses rapidly to 50%
3. Stays at 50% for 5+ Minutes
4. Progresses rapidly to 100%
5. The zip creation and deletion happens when the bar is at around 100%
I don't think I'd be able to snatch the zip manually, it is only there for the blinkt of an eye.
03-10-2023 03:57 AM
- Mark as New
- Bookmark
- Subscribe
- Mute
- Subscribe to RSS Feed
- Permalink
- Report to a Moderator
@Florian.Ludwig wrote:
All systems use the same AV.
I don't suspect a timeout because there seems to be one system that builds successfully more often than the others, and it is the slowest machine.
Some weird race condition then? Maybe a process A that starts after B, and succeeds only if B takes longer than parallel process C.
If the slowest has more success, maybe limit the other systems? For instances by running a few loops in parallel?
Not as a solution of course, but to gather information.
The build process uses the LabVIEW code in the vi.lib\AppBuilder. The API is in Functions>Application Control>Application Builder. The process might be debuggable to some extend.
03-10-2023 12:06 PM
- Mark as New
- Bookmark
- Subscribe
- Mute
- Subscribe to RSS Feed
- Permalink
- Report to a Moderator
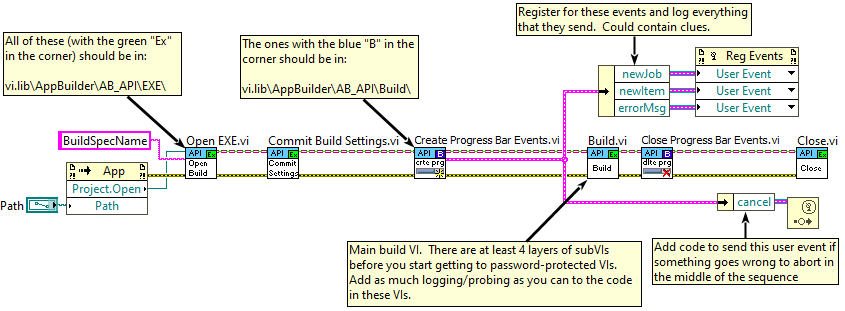
I don't have a solution for you but I have an idea that might get you more information and, hopefully, something that you can use to either figure out the problem and maybe even find a resolution for it quicker than just repeated builds until the EXE is large enough.
Try creating your own build VI starting with this:
The hope would be that if you do a build where you can monitor it along the way, you might be able to find a "telltale" of some kind before the build completes and either be able to rerun just a small section of the build until it works, or start over sooner and not waste as much time. Or at the very least get a better handle on the problem to possibly alter your build or code to resolve, or to be able to give NI information enough to get a proper bug report filed.
03-10-2023 12:27 PM
- Mark as New
- Bookmark
- Subscribe
- Mute
- Subscribe to RSS Feed
- Permalink
- Report to a Moderator
Thanks for that Kyle, I've been having a very similar problem on a similarly large project - if the build doesn't work, the ending exe is 128KB (versus 100,000 KB for a properly built one). The build will run successfully according to LabVIEW, then when I try and actually run the exe I'll get a 'Fatal Internal Error Memory Manager.cpp 0xf50EFD7B' error. I'm running in LV2020 32bit, but it sounds very much like the same issue the TS has. I've shifted priorities and haven't messed with this project in a while, but when I get back to it I will try your suggestion and update the thread if I find any useful information.
03-13-2023 09:25 AM
- Mark as New
- Bookmark
- Subscribe
- Mute
- Subscribe to RSS Feed
- Permalink
- Report to a Moderator
I have run the build with a vi like the one Kyle suggested.
It produced the same too small executable most build attempts do.
No error was logged - in fact the messages look a lot like the log the builder can output if that option is checked in the definition.
I logged 7589 messages - 2 newJob, the rest newItem.
The tail end of the build process is a lot of saving,
then Building application...,
then the second newJob with the build destination as lable,
and lastly: the build is complete.
LabVIEW seems unaware that something went wrong.
I currently have no idea how to dive deeper. It seems the problem is in the building application step (which takes 3 seconds).
I'll go poke at the build vis and see if sth stands out to me.
03-13-2023 10:18 AM
- Mark as New
- Bookmark
- Subscribe
- Mute
- Subscribe to RSS Feed
- Permalink
- Report to a Moderator
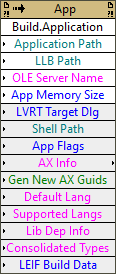
I'm not sure, but I suspect at some point LV calls:
and if the problem is in there, you're back to square one...
03-13-2023 11:00 AM
- Mark as New
- Bookmark
- Subscribe
- Mute
- Subscribe to RSS Feed
- Permalink
- Report to a Moderator
It does indeed.


