LabWindows/CVI Idea Exchange

cancel
Showing results for 
Search instead for 
Did you mean: 
José_M._Vólquez_R.

Functions/Source Files hierarchy/relationship window

Hi Everyone!


In these days, I have been debugging a complex application(almost 12,000 lines of code) and it was very hard to do a map showing the relationshing at least of some critical functions.


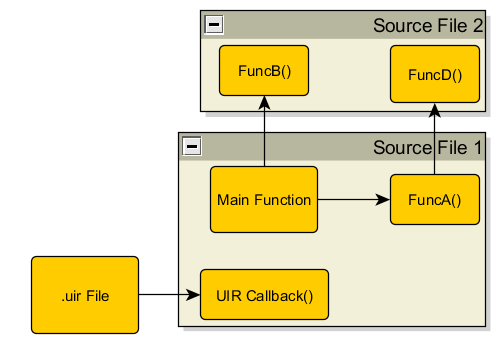
For this reason, I consider that a very helpful debugging tool could be to add in LabWindows/CVI, a window like the VI Hierarchy in LabVIEW; that shows the relationship beetween the functions inside all the module in a CVI project. This windows will show which functions calls a particular function.


Here, there is a very simple example:

Untitled.png


Regards!

6 Comments
Wolfgang
Trusted Enthusiast

I wonder how your graph looks like if it is build from 12000 lines of code - it's difficult to imagine that it will be as clear as your example if there are hundreds of functions... I'm not convinced yet (but if you can provide additional arguments this might change Smiley Wink)...


Right now I feel that a line based approach such as the current source code browser does better

José_M._Vólquez_R.
NI Employee (retired)

Hi Wolfgang,


Thank you for the comment. As you said, graphs for complex codes, like ones with thousand of lines; will be difficult to read and interpret. But I think it depends on how the tool would be developed:


If the tool includes many filters like: show only user defined functions or see only one section, etc...maybe this will facilitate the use of the tool.


I know that Source Code Browser tool allows to figure out the relationship between functions but you can't see the hierarchy of 2 functions at the same time for example, and also it is not as intituive as the VI hierarchy in LabVIEW.


What happens if I am troubleshooting race conditions on a CVI application? How easily can I know the functions that are trying to use a shared resource?


I also think in this feature as a complement for documentation purposes.


Thanks!

40tude2
Member

There are options available on the market as well as in the GNU community and it is not easy to write it yourself because you must have access to the AST to do it correclty (think about function calls embeded in macros for example)


Anyway, Doxygen can do it for sure (CALL_GRAPH option)

Visual Studio 2013 now include a graphing representation of the solution : http://msdn.microsoft.com/en-us/library/dd409453.aspx


I truelly believe this kind of tool would really help users 

Regards, Philippe


José_M._Vólquez_R.
NI Employee (retired)

Thanks Phillipe for sharing me the link and posting.


As you said, this would be a helpful tool; specially when we are troubleshooting third-party code.


Regards!

JonathanN
NI Employee (retired)
Status changed to: Under Consideration
 
Jonathan N.
National Instruments
gdargaud
Active Participant
If you do this, please leave it as an external tool and don't turn CVI into LabView or UML: I cannot stand graphical languages. Having suffered through a 2-week UML 'formation' a couple years ago I came out not even able to do a 'hello world'. Graphical programming is just not for everyone.