- Subscribe to RSS Feed
- Mark Topic as New
- Mark Topic as Read
- Float this Topic for Current User
- Bookmark
- Subscribe
- Mute
- Printer Friendly Page
Graphical sourcecode issues while debugging
08-12-2014 01:35 AM
- Mark as New
- Bookmark
- Subscribe
- Mute
- Subscribe to RSS Feed
- Permalink
- Report to a Moderator
Currently we are trying to setup our new testsystems with Teststand 2013, and LabWindows CVI 2013 SP2 as coding base for dlls.
At the moment, theres a very annoying bug, i can't resolve during the debug process in LabWindows CVI.
The problem is, that the most functions are debugged correctly, but LabWindows CVI has some strange behaviour with other, well developed and tested functions.
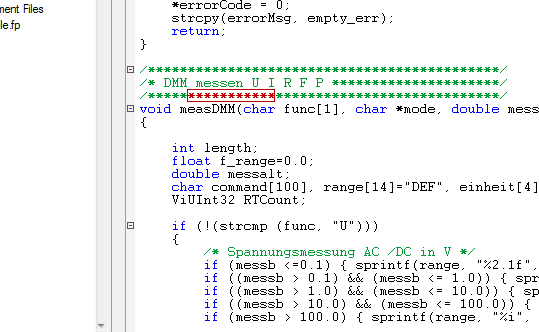
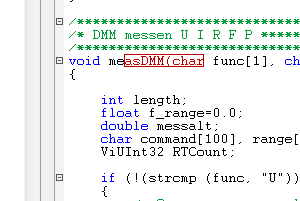
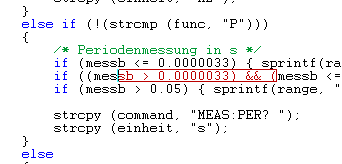
I can manually step throught them, CVI executes the right commands in background, but shows weird things in its code area, like on this picture.
Sometimes it shows comments as command, steps thought empty lines, or shows half of a command and variable as code command.
It seems, like CVI executes commands in other sourcecode lines, than shows in its red marked are.
The shown code works as it should, but debugging isn't possible with this issue.
I hope, someone can help us with this problems.
08-12-2014 01:58 AM
- Mark as New
- Bookmark
- Subscribe
- Mute
- Subscribe to RSS Feed
- Permalink
- Report to a Moderator
Hello swenbo89,
1. Was the code modified since it was last time built? If it was modified then the highlight corresponds to the location when the code was last built.
2. Do you use #line directives? #line modifies the source position so the debugger records a different line than the one in the source file.
3. Do you see a correlation between the highlight in the editor and the statement that should be highlighted?
Constantin
08-12-2014 02:55 AM
- Mark as New
- Bookmark
- Subscribe
- Mute
- Subscribe to RSS Feed
- Permalink
- Report to a Moderator
Hi ConstantinP,
1. I know this behaviour since old LabWindows CVI days, because of that i build my project every time before i execute it.
2. No, we don't use line directives
3. No, i can't see any any correlation. I tried to follow the highlighted lines and compared it to the happenings in the watch expression window, but no chance.
08-12-2014 03:26 AM
- Mark as New
- Bookmark
- Subscribe
- Mute
- Subscribe to RSS Feed
- Permalink
- Report to a Moderator
Hello swenbo89,
Do you see this behavior only when you run the dll from Teststand?
Did you try a rebuild(Build->Rebuild menu). I’m thinking maybe CVI doesn’t see the project as modified and it doesn’t re-build it.
You could see in the Call Stack (Window->Variables and Call Stack) which function is executing when the highlight is incorrect and see at least in which function the correct line should be.
Constantin.
08-12-2014 04:12 AM - edited 08-12-2014 04:12 AM
- Mark as New
- Bookmark
- Subscribe
- Mute
- Subscribe to RSS Feed
- Permalink
- Report to a Moderator
No, i see this too, when i debug my code as an executable, and it doesn't matter if i call the debug process from Teststand or LabWindows CVI directly.
Everytime i try to debug i do a Rebuild, further i tried to clean the output and to build it again but no chance .
In this Call Stack Window the right function is active, but inside some functions only the steps won't be displayed in the right behaviour.
08-12-2014 04:29 AM
- Mark as New
- Bookmark
- Subscribe
- Mute
- Subscribe to RSS Feed
- Permalink
- Report to a Moderator
Could you post a screenshot with Editor Preferences (in source editor Options>>Editor Preferences)
Also you could export all the settings so I could try to reproduce the problem with your settings. To export the settings open Start>>All Programs>>National Instruments>>LabWindows CVI 2013>>Tools>>LabWindows CVI 2013 Import-Export Settings. In the upper ring select CVI 2013 and in the bottom one select File and enter an xml file. When clicking Apply an xml file with the registry settings is generated.
If it happens only with some files, could you provide a simple file that exhibits the problem?
Constantin
08-12-2014 08:01 AM
- Mark as New
- Bookmark
- Subscribe
- Mute
- Subscribe to RSS Feed
- Permalink
- Report to a Moderator
@Constantin--P wrote:
1. Was the code modified since it was last time built? If it was modified then the highlight corresponds to the location when the code was last built.
I have seen that behavior when I mistakenly edit the source while the debugger is running.
09-05-2014 12:45 PM
- Mark as New
- Bookmark
- Subscribe
- Mute
- Subscribe to RSS Feed
- Permalink
- Report to a Moderator
Hi, svenbo89—
You mentioned in an earlier post that within one source file, this behavior only happens for certain functions. If you take those functions out of the source file and try to debug them in a simpler project, does the debugger still behave this way?
Does this always happen on the same functions, or is it random?
Do you set breakpoints at run time?
Thanks,
National Instruments


