I'm using DAQmxReadBinaryI16 to read 8 channels data & save to file.
I modify the ContAcq-IntClk-EveryNSamplesEvent.proj, by changing
DAQmxErrChk (DAQmxReadAnalogF64(taskHandle,nSamples,10.0,DAQmx_Val_GroupByScanNumber,data,nSamples*numChannels,&numRead,NULL));
to
DAQmxErrChk (DAQmxReadBinaryI16(taskHandle,nSamples,10.0,DAQmx_Val_GroupByChannel,databuf,nSamples*numChannels,&numRead,NULL));
To scan 8 channels data, I set
DAQmxErrChk (DAQmxCreateAIVoltageChan(taskHandle,"Dev1/ai7:0","",DAQmx_Val_Cfg_Default,min,max,DAQmx_Val_Volts,NULL));
Samples per Channel = 5000
Sample rate = 5000
I run the scanning for hours & save all 8 channels data (in short) everysecond.
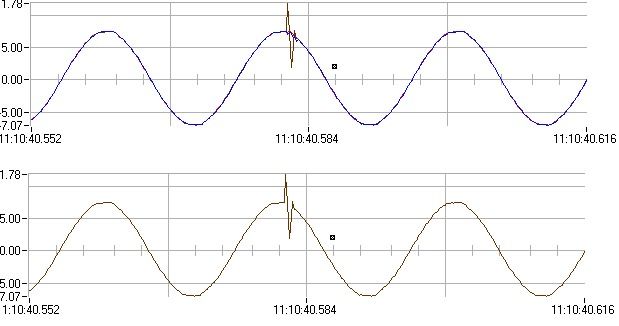
I found data of 1 channel looks like this after 1 hour scanning.
First graph is plotting data from Channel 1, 2, 3, with same input.
Second graph is plotting data from Channel 2.
part of the data (in short & in double)
chan 1 chan 2 chan 3 chan1 chan2 chan3 <-- after scalling using ScaleCoef
| -162 |
-161 |
-161 |
0.073428 |
0.073757 |
0.073757 |
| -159 |
-161 |
-160 |
0.074415 |
0.073757 |
0.074086 |
| -159 |
-160 |
-159 |
0.074415 |
0.074086 |
0.074415 |
| -159 |
-159 |
-159 |
0.074415 |
0.074415 |
0.074415 |
| -158 |
-159 |
-157 |
0.074744 |
0.074415 |
0.075073 |
| -172 |
-27 |
-164 |
0.070138 |
0.117849 |
0.07277 |
| -161 |
-162 |
-158 |
0.073757 |
0.073428 |
0.074744 |
| -170 |
-329 |
-164 |
0.070796 |
0.018478 |
0.07277 |
| -185 |
-224 |
-174 |
0.06586 |
0.053027 |
0.06948 |
| -184 |
-155 |
-185 |
0.066189 |
0.075731 |
0.06586 |
| -205 |
-191 |
-193 |
0.059279 |
0.063886 |
0.063228 |