- Subscribe to RSS Feed
- Mark Topic as New
- Mark Topic as Read
- Float this Topic for Current User
- Bookmark
- Subscribe
- Mute
- Printer Friendly Page
Very High CPU load and very long delay before engine runs
02-22-2017 03:45 PM
- Mark as New
- Bookmark
- Subscribe
- Mute
- Subscribe to RSS Feed
- Permalink
- Report to a Moderator
I was curious whether the DCAF engine would consume a lot of CPU time itself, so I conducted a test.
I have a very simple module that generates a random number solely.
First of all, the time it takes between initialization and running the engine is extremely high (180 sec in average). I used a stop watch timer to measure this time (see the attachment)
Second, after running the CPU load is about 90%. I am using the "RT Get CPU Loads" API for measurement. In the configuration editor the standard engine is set to run every 10 ms. (Timing Source Type=1 MHz, Timing Source dt=10000).
I am using a cRIO-9014.
Any idea why it is so inefficient?
02-22-2017 03:55 PM
- Mark as New
- Bookmark
- Subscribe
- Mute
- Subscribe to RSS Feed
- Permalink
- Report to a Moderator
That sounds pretty good to me considering the 9014 runs VxWorks, and has a very old PowerPC processor running at 400MHz.
Take a look at the performance numbers shown here (note that the 9014 is about half as fast as the 9025): http://www.ni.com/white-paper/52250/en/
I expect you'd get much much lower CPU usage numbers if you ran this on any recent LinuxRT based cRIO 🙂
02-22-2017 04:00 PM
- Mark as New
- Bookmark
- Subscribe
- Mute
- Subscribe to RSS Feed
- Permalink
- Report to a Moderator
Hello!
We target the 9068 (dual-core Linux RT controller) as the minimum hardware for the framework to run on, and we make sure that the framework is usable on targets of that vintage or newer. We do not test on the older VxWorks cRIO units. As Craig mentioned, it is not surprising that a 9014, which is a *much* less powerful controller than the 9068, struggles to keep up. I do not recommend trying to use DCAF on the VxWorks controllers, even though you might be able to do so with the 902x series.
Matt Pollock
National Instruments
02-27-2017 09:53 AM
- Mark as New
- Bookmark
- Subscribe
- Mute
- Subscribe to RSS Feed
- Permalink
- Report to a Moderator
When DCAF was first being prototyped years ago, it was tested on cRIO-9014's regularly, but that is no longer the case now that they are legacy hardware. That said, we can get 1kHz loop rates on a cRIO-9068 and still have plenty of remaining CPU overhead, so the results that you are seeing when going 10x slower are a little surprising to me. With only one module in the system configuration, how are you verifying that your custom module is executing? Also how often are you requesting the CPU measurement? That function itself can take a lot of resources to execute and shouldn't be called too frequently. Finally, have you tried enabling the timing reporting tags in the Standard Engine so it can report its own execution time?
Again I agree that I wouldn't expect great performance for DCAF on a 9014, but there may still be a few things going on to slow this down. Given that this is a single-core target, any code running on the system will be competing with DCAF execution on that core.
03-02-2017 03:00 PM
- Mark as New
- Bookmark
- Subscribe
- Mute
- Subscribe to RSS Feed
- Permalink
- Report to a Moderator
Thank you for the comments.
So to answer to your question, I removed the the function that was obtaining the CPU information. Instead I use MAX for the statistics. I also enabled the timing reporting tags and mapped them to my module.
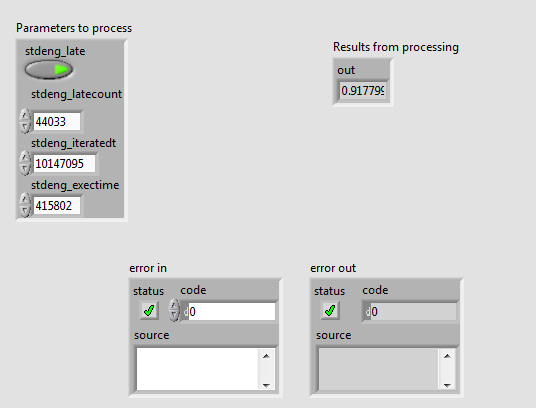
Here is a screen shot of "user process.vi" front panel:
It seems it is running late all the time. The standard engine is set to run every 10 ms. Can you explain what are the iteratedt and exectime and their unit?
MAX shows the CPU total time is between 70% to 80%. There is a very long delay (130 sec) between initialization and running of the engine during which I loose connection to the cRIO.
Thank you
03-02-2017 06:26 PM - edited 03-02-2017 06:26 PM
- Mark as New
- Bookmark
- Subscribe
- Mute
- Subscribe to RSS Feed
- Permalink
- Report to a Moderator
Its been a while since I worked on this, but if I recall correctly, timing units are converted to nanoseconds. If you note the engine iteration is 10,000,000 ns = 10 ms. It also indicates that the engine is only executing for a tiny fraction of that period (415,802 ns = <0.4 ms).
The 'finished late' (assuming nothing has changed in a while) is a bug of sorts where *any* value over exactly 10 ms would be considered late. Given that your CPU is at 90%, jitter of 147 usec isn't all that surprising.
Long story short, that data seems to me to indicate that the dcaf engine isn't the cause of the CPU issue.
03-03-2017 06:28 PM
- Mark as New
- Bookmark
- Subscribe
- Mute
- Subscribe to RSS Feed
- Permalink
- Report to a Moderator
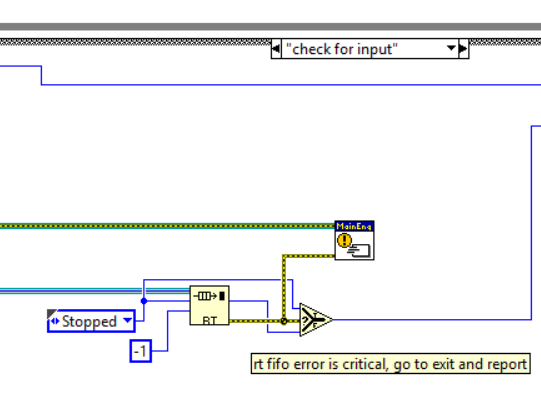
I took some time to run a simple example on a 9014 today, and I believe I may have found root cause. When the 'Standard Engine' gets launched, it waits for a command to start initializing the plugins, and then another to transition to the run state. Commands are also used to stop the Engine when in run state. For maximum performance and minimum latency, we use an RT FIFO to communicate these commands within the engine. However when waiting to receive commands to initialize and start running, the timeout value is set to '-1'.
This is a problem in the case of the 9014, because the RT FIFO's 'r/w mode' is set to 'polling' for maximum performance while in the running state. From the LabVIEW Help:
Polling mode uses up CPU cycles, and therefore competes for those cycles during initialization on a single CPU processor, causing the initialization to take much longer than normal. This is technically also an issue on multi-core controllers, but with the extra core the polling typically wouldn't last more than a few seconds. This section of code was one of the last to be refactored, which is why the problem didn't exist for these controllers in older versions of the framework. I have made a record of this as an issue on GitHub.
Once working around that problem, the final performance ended up at ~40% total CPU with each iteration of the engine taking ~725 us. This was for a configuration with 3 plugin modules running at 100 Hz. Again the performance isn't fantastic, but is still far from full utilization. Thanks for taking the time to share this.


