- Subscribe to RSS Feed
- Mark Topic as New
- Mark Topic as Read
- Float this Topic for Current User
- Bookmark
- Subscribe
- Mute
- Printer Friendly Page
Cluster Typedef Constant Display Glitch
06-23-2016 06:44 PM
- Mark as New
- Bookmark
- Subscribe
- Mute
- Subscribe to RSS Feed
- Permalink
- Report to a Moderator
Take any cluster constant (I am illustrating this with an error cluster) and connect it to an indicator.
Display the constant as an icon:
Make the indicator a typedef and save it:
Now, select the constant and replace it with the typedef you just created (right-click > Replace > Select a VI...):
Yep...
Here is another example with the cluster I discovered this problem with:
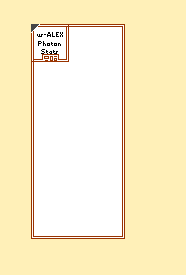
In short, the display is bogus.
Now if you sequentially cycle through:
- uncheck View Cluster as Icon
- check View Cluster as Icon
things return to normal:
Well... almost!
Tested in LabVIEW 2015 SP1 64 bits, Windows 7
06-23-2016 08:14 PM
- Mark as New
- Bookmark
- Subscribe
- Mute
- Subscribe to RSS Feed
- Permalink
- Report to a Moderator
Mike...
Certified Professional Instructor
Certified LabVIEW Architect
LabVIEW Champion
"... after all, He's not a tame lion..."
For help with grief and grieving.
06-25-2016 10:26 AM
- Mark as New
- Bookmark
- Subscribe
- Mute
- Subscribe to RSS Feed
- Permalink
- Report to a Moderator
Yes, I've seen this silliness before. The last picture reminds me of how sometimes LabVIEW doesn't clean up stray pixels, as if it miscalculates the area it needs to clean up. If you scroll the offending pixels out of the BD window and come back, the pixels are gone.
(Mid-Level minion.)
My support system ensures that I don't look totally incompetent.
Proud to say that I've progressed beyond knowing just enough to be dangerous. I now know enough to know that I have no clue about anything at all.
Humble author of the CLAD Nugget.
06-25-2016 11:07 AM
- Mark as New
- Bookmark
- Subscribe
- Mute
- Subscribe to RSS Feed
- Permalink
- Report to a Moderator
I do use to get this more often when I was using LV 2011 back 2 years ago and had to scroll up and down. Run a VI in highlight mode (Larger VI Preferebly) Left Click and Drag the diagram around we can see this type of glitch even in 2015.
The best solution is the one you find it by yourself
06-25-2016 03:25 PM
- Mark as New
- Bookmark
- Subscribe
- Mute
- Subscribe to RSS Feed
- Permalink
- Report to a Moderator
OK, but I am not describing one of those typical display refresh failures you are mentioning. This kind of glitch can be solved by a Ctrl+Run Arrow action.
I am pasting a snipet of a VI obtained following the instructions above (the necessary typedef can be found as attachment):
This stuff is a different beast. Try Ctrl+Run Arrow, the cluster is definitely not reverting to anything sensible.
Only the sequence of uncheck/check View as Icon actions I described solves the problem.
06-25-2016 03:39 PM - edited 06-25-2016 03:40 PM
- Mark as New
- Bookmark
- Subscribe
- Mute
- Subscribe to RSS Feed
- Permalink
- Report to a Moderator
@X. wrote:OK, but I am not describing one of those typical display refresh failures you are mentioning. This kind of glitch can be solved by a Ctrl+Run Arrow action.
I am pasting a snipet of a VI obtained following the instructions above (the necessary typedef can be found as attachment):
This stuff is a different beast. Try Ctrl+Run Arrow, the cluster is definitely not reverting to anything sensible.
Only the sequence of uncheck/check View as Icon actions I described solves the problem.
Sorry, my post was misleading. I've seen this as well, and it's just plain goofy. It's not a graphics glitch in the sense of a bad window refresh; it's as if LabVIEW couldn't decide how to best display it, so it used a blending of a few different ways. In this case, like a cluster and an icon at the same time.
(Mid-Level minion.)
My support system ensures that I don't look totally incompetent.
Proud to say that I've progressed beyond knowing just enough to be dangerous. I now know enough to know that I have no clue about anything at all.
Humble author of the CLAD Nugget.


