- Subscribe to RSS Feed
- Mark Topic as New
- Mark Topic as Read
- Float this Topic for Current User
- Bookmark
- Subscribe
- Mute
- Printer Friendly Page
Debugging exotic LabVIEW problems - Performance Monitor
09-23-2016 05:36 AM
- Mark as New
- Bookmark
- Subscribe
- Mute
- Subscribe to RSS Feed
- Permalink
- Report to a Moderator
I want to list off some options for debugging LabVIEW applications which go beyond the usual debug options and Profiler. Others may have significantly more knowledge in this area than I do, but I don't recall ever seeing posts on this topic before on the Forums, so here goes.
This investigation was done with my colleageue dan_u so if you like this information, please throw a few Kudos his way too. ![]()
Intro:
We recently had some really weird behaviour from our software, it was getting slower and slower as time went on with the UI becoming completely unusable after 2-3 days of operation. UI response times of up to 9 or 10 seconds were not unusual. Running VI Profiler showed nothing particularly out of the ordinary.
We tried profiling, we tried the Event Monitor (whatever it's called), nothing showed up anything particularly out of the ordinary. No huge lists of events waiting to be handled, no particular VIs taking huge amounts of time to execute.....
We turned to the Desktop Execution Trace Toolkit. In order to try to localise which thread is doing which work, we found out that Thread zero in the Desktop Execution Trace Toolkit is the UI Thread of an application instance. This way one can see what is happening there and if code which should not be running in the UI Thread is, or if code running in the UI Thread is simply being called too often. We had feared a circular cascade of events (actually occurrences, but whatever) which might be causing A to call B which called A which calls B and so on. We put in custom events for DETT to closer inspect which code pieces were doing what and for how long. For us, unfortunately, nothing seemed particularly out of the ordinary.
We had essentially exhausted the LabVIEW-internal tools at this stage. Everything seemed OK. We needed to dig deeper.
How we dug deeper:
-NOTE- The following tool is mentioned ONLY for those cases where you have run out of options with the tools supplied by LabVIEW. Do NOT do this as a first response to performance / memory problems with your code.
We turned to a windows tool, Performance Monitor. This tool is AWESOMESAUCE and allows investigation into all kinds of parameters LAbVIEW programmers normally don't need to know or care about let alone be able to monitor in real-time.
Do you want to know how many cache hits and cache misses your application causes in a second? Performance Monitor.
Do you want to be able to monitor the precise memory allocation chararacteristics of your program? Performance Monitor.
Do you want to know detailed statistics ont he Disk I/O of your program? Performance Monitor.
Do you want to monitor the number of context switches happening in a specific thread of your program? Performance Monitor.
You can start Performance monitor by entering "perfmon" in the start menu of Windows (I use Windows 7).
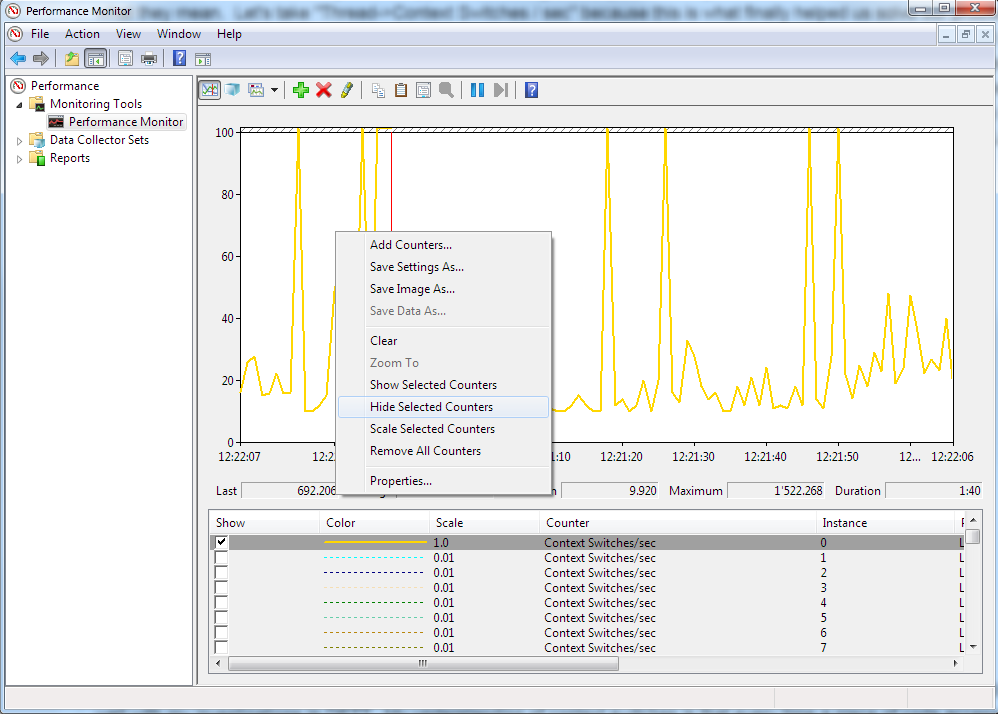
If you select the default Live view (Performance -> Monitoring Tools -> Performance Monitor), you can right click the graph and choose "Add Counters".
Here you are supplied with a huge list of parameters you can monitor, most of which I simply do know what they mean.
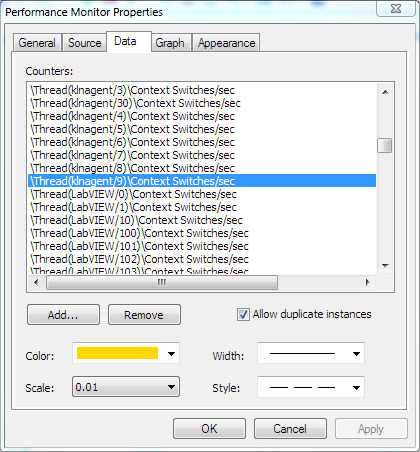
Let's take "Thread->Context Switches / sec" because this is what finally helped us solve our problem. When selecting it adds the counter for every thread registered in the system which is a lot. You will receive an error that not all can be shown on teh graph, not surprising since there are thousands of them. We need to remove those we are not interested in in a second step. Right-click on the list of items in the lower portion of the screen and choose "Properties". In the image below I have located "LabVIEW" in the list. I can delete all others from the list (Above and below) by selecting them and pressing the "Remove" button. Do the same thing for the elements after LabVIEW. Now the only threads shown should be labVIEW related.
My research has shown that also here, thread ZERO is the UI Thread. I have no proof for this, but is seems to add up very well with my investigations in DETT. My understanding of context switches is that every time a piece of code accesses a property node which runs in the UI Thread, this causes 2 context switches, one to the UI Thread and one away from it. So this way you can estimate the number of times your code is switching to the UI Thread. I have absolutely no other information regarding the other threads.
Our solution:
In our code, we saw some very strange behaviour where just having certain Front Panels OPEN (not running) caused massive spikes in the number of context switches per second in the UI thread (jumped from 3k to 30k). Deleting controls one by one from the Front Panel eventually led us to the fact that we had some messed up controls on the FP which were sending the UI thread crazy. Replacing these controls with visually identical new controls solved the problem. Done and dusted. Customers have since received a new version of the software and confirm that the software no longer slows down over time. Amazeballs.
Summary:
This post is not a "Here's how to solve this problem" but rather a post highlighting how we can go significantly beyond the realm of LabVIEW tools in order to try to track down what is going wrong in our code. Understanding of threads, windows and all kinds of other systems helps in being able to interpret what we see. Each problem may have a unique source, but that source MAY be easier to find if we have access to the extremely detailed information provided by Performance Monitor.
We tried monitoring a whole host of other parameters before we arrived at the "Context switches" data. I imagine using a tool this detailed can be very tiring as it's hard to narrow down what's important. Each problem needs to be approached anew. If you find you need to dig deeper, Performance Monitor is perhaps a useful shovel.
What still sucks:
Performance Monitor is really unfriendly when you want to chance scaling of the counters selected or change line style or colour. Double-clicking each one and setting the properties is a really awkward way of doing things. If anyone knows of a better way, plese add your comments.
09-23-2016 07:06 AM - edited 09-23-2016 07:08 AM
- Mark as New
- Bookmark
- Subscribe
- Mute
- Subscribe to RSS Feed
- Permalink
- Report to a Moderator
Yes, it was very interesting to work with the Performance Monitor. We learned a lot about our software. For instance we were wondering if we let things run quite fast why we could never utilize more than 1 CPU core (CPU load 12-13% on a 8 core machine). Turned out that basically only the UI thread is causing load, and of course a single thread cannot run on multiple cores. Windows might switch the thread between cores, but a thread is always bound to a core.
(Our application is mainly displaying data in different graphs and indicators at different speeds, the processing is done on RT and FPGA, that's why it makes sense the UI thread is busy.)
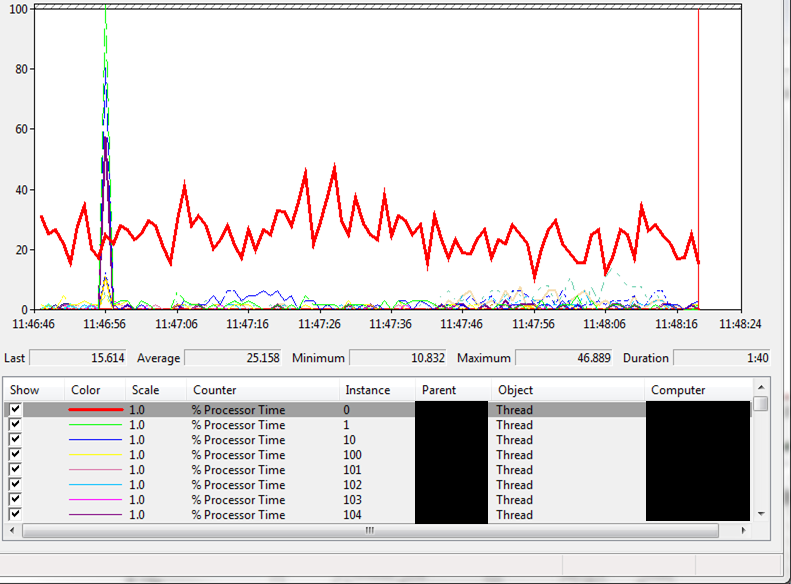
The Thread > "% Processor Time" in the Performance Monitor lets you observe how much of a single core each thread utilizes.

You can of course also use the Performance Monitor on compiled applications. Just select all the threads of the application.
Back to Context Switches.
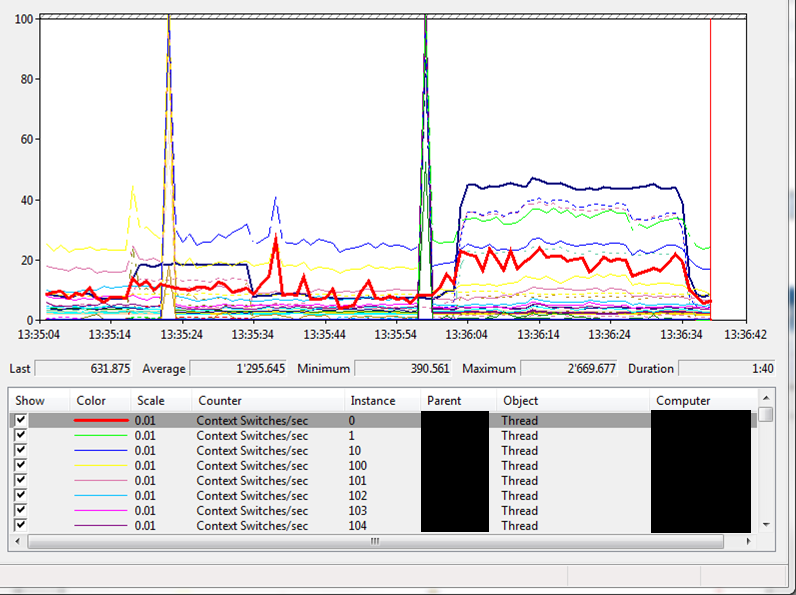
This is the graph before finding and replacing the affected bad controls (which would cause load with just the front panel open, not even running the VI):

And this is after replacing the dodgy controls:

Our customers finally have a software that does not become sluggish over time.
09-23-2016 08:28 AM
- Mark as New
- Bookmark
- Subscribe
- Mute
- Subscribe to RSS Feed
- Permalink
- Report to a Moderator
Thank you both for taking the time to share all this information! I /REALLY/ appreciate it!
Sometimes, all you have left in your tool-box is an excavator, perfmon seems like a good excavator, unfortunately it does not work on the moon (RT) where I live most of my time. 😛 I need a 'moonscavator for that! 😛
I'm glad I'm not the only person who has ever stumbled across some extremely bizare behavior in LV/LV IDE/LV compiled code. One of my favorites was probing two boolean values going into a simple boolean operation (I forget if it was AND or OR), and probing the output was demonstrably giving the wrong result. It's a strange feeling when a computer repeatedly tells you that "true" OR "false" = false or some such. (And I already knew it was not an issue with the probes, because the rest of the program would act on the incorrect boolean output.)
Clearly it had to somehow be human error, so I actually double checked that a) the operator was the one I expected, b) the truth table for that operation had not changed in online reference manuals vs my memory, and c) that I did not have a case of 'that wire looks like it went to here, but in fact it cleverly was hidden underneath and went to there instead". In desperation and horror, I did the only sane thing left to do; I deleted most of the offending block diagram (possibly including controls/indicators) and re-created it, and the issue went away.
Other such issues I have seen include back a few years (again happened on a couple of occasions) when an asynchronous call-and-forget would suddenly not launch the process, but giving no error message to that fact, and no issue during compile (to RTexe). This was fixed by deleting the strict type-def and asynch call and re-creating.
Most recently (a few days ago) in LV2016 I was re-reminded why I have a deep misstrust towards the feedback node. For some reason I have several times experienced that feedback nodes do not always work when compiled to RTexe even if they work in developer mode. In the most recent case, I would carry a ms counter value on a feedback node to calculate how many ms elapsed since last 'trigger' time. The node would re-set to 'current ms value' every x ms using a case and a "less than" compare to trigger the case. In compiled code, it would not work (basically triggering every time instead of after 60k ms). I replaced it (as I have done so many times before) with the same functionality wrapped in a FG. I have no clue why, but something is 'fragile' with feedback nodes on RT targets.
-------------
CLD LabVIEW 7.1 to 2016
09-23-2016 11:55 AM
- Mark as New
- Bookmark
- Subscribe
- Mute
- Subscribe to RSS Feed
- Permalink
- Report to a Moderator
Shane and Dan,
Thanks (and kudos!) to you both for such a well-written pair of postings about debugging when things get really strange - I'll remember this for those timeswhen some of my larger, long-running compiled applications become UI-sluggish, as they occasionally do.
I've used PerfMon functionality from within LabVIEW (via .NET), but can't say I've really spent any time using its native interface to troubleshoot (instead of merely muttering curses at) an unresponsive LV-built executable.
Dave
Sr. Test Engineer
Abbott Labs
(lapsed) Certified LabVIEW Developer
09-23-2016 12:53 PM
- Mark as New
- Bookmark
- Subscribe
- Mute
- Subscribe to RSS Feed
- Permalink
- Report to a Moderator
Wait. What? It can be automated? Amazeballs again. ![]()
09-23-2016 01:04 PM
- Mark as New
- Bookmark
- Subscribe
- Mute
- Subscribe to RSS Feed
- Permalink
- Report to a Moderator
Here is a link to something I used. https://decibel.ni.com/content/docs/DOC-9292
I'm not sure if it is exactly the same parameters. It is called task manager, but looks like it is grabbing some things you'd see in performance monitor.
09-23-2016 04:26 PM
- Mark as New
- Bookmark
- Subscribe
- Mute
- Subscribe to RSS Feed
- Permalink
- Report to a Moderator
What is a "messed up control"? Would this show up using the insane object Heap Peek tool?
09-23-2016 05:39 PM
- Mark as New
- Bookmark
- Subscribe
- Mute
- Subscribe to RSS Feed
- Permalink
- Report to a Moderator
Shane,
For what it's worth (and after 5PM on a Friday, at least here in US/Eastern), I've attached the little bit of .NET LabVIEW code I fiddled with a couple of years ago that traverses some of the Windows Performance Counter API. I based it off of some C# examples I found on MSDN or StackOverflow or... (I should've made better notes). That said, it was developed under LV2011, where it still seems to work OK, but it's not working quite right under 2014, and I suspect it has to do with LV migrating from CLR 2.0 to CLR 4.0.
There's a shortcut menu option on the "Category" combo box ("Refresh Category List") which attempts to get all the perfcount categories and load their names into the combo box. This works under 2011, but steadfastly errors out under 2014. I suspect some .NET translation layer is not working right, because it complains about a missing "CategoryName" parameter which simply shouldn't be needed per the C# examples I find online.
If you just use the string entries already in the combo box (as saved), you can still generally get the code to work as intended. On ValueChange of the "Category", the code gets all instances by name, then gets all counters per instance by name, and loads the "Counter::Instance" combo. (If there are no instances, it just loads the counters.) Whenever the "Counter::Instance" gets a ValueChange, the code creates the performance counter, and updates it ( on event timeout, once a second thereafter) until another control is changed.
I've tried a bit to get this to work under 2014, but am stuck with the category update code not behaving. Since the list of allowed categories may differ on your target PC from mine, the static list may not be correct or complete. <rant>I find .NET extremely difficult to incorporate, mostly because it's tedious just to find the constructor/method/property you need, in the first place.</rant>
I'll be out of office most of next week, but I'll have my laptop with me. If you have any followup I'll try to keep tuned in.
Oh, and it looks like the code RavensFan references uses CLNs to call DLLs supplied with the sample project, so I don't know if it's using the Performance Monitor stuff under the hood.
Dave
Sr. Test Engineer
Abbott Labs
(lapsed) Certified LabVIEW Developer
09-24-2016 02:13 AM
- Mark as New
- Bookmark
- Subscribe
- Mute
- Subscribe to RSS Feed
- Permalink
- Report to a Moderator
Maybe heap peek would help but without knowing which VIs are the problem thats not terribly efficient.
I really wish LabVIEW would automatically report suspiscious things thatbmay be detectable vianheap peek.
09-24-2016 02:06 PM - edited 09-24-2016 02:18 PM
- Mark as New
- Bookmark
- Subscribe
- Mute
- Subscribe to RSS Feed
- Permalink
- Report to a Moderator
Thanks for the responses.
@QFang: We also have issues with RT, mostly deploy errors with classes, and old VIs being deployed when not saving the whole hierarchy (from the modified VI up to the RT top level VI). Annoying. I haven't seen the issue with feedback nodes yet, but your comment makes me wonder if they should be used...
@RavensFan: Thanks for the link, I think I have seen that a loooong time ago but didn't go into detail. I'll try this tool again to see what it reports.
@X: We use lots of customized controls (saved as controls, type defs, strict type defs). Some of them just seem to have this issue. I assume something in these controls makes LabVIEW redraw them constantly, causing lots of context switches to the UI thread and also some CPU load (when just opening a front panel with one of these controls or the type def itself). We've seen this happening with slide controls and enums. We couldn't find a pattern which controls were affected. For instance we have a 2 slider slide control and a 1 slider slide control of the same type. The 1 slider control was affected by the redraw issue, the 2 slider version was not. Recreating the 1 slider control from the 2 slider control fixed the issue.
We can check if heap peek reports anything insane on the buggy (messed up) controls.
@Dave: thanks for that, sounds also interesting. I didn't see a way to save the configuration in the performance monitor, so using an API could be pretty useful (instead of reconfiguring the tool each time you want to use it).


