- Subscribe to RSS Feed
- Mark Topic as New
- Mark Topic as Read
- Float this Topic for Current User
- Bookmark
- Subscribe
- Mute
- Printer Friendly Page
Display two 1D arrays on Wavechart
Solved!04-05-2016 06:14 AM
- Mark as New
- Bookmark
- Subscribe
- Mute
- Subscribe to RSS Feed
- Permalink
- Report to a Moderator
04-05-2016 06:29 AM
- Mark as New
- Bookmark
- Subscribe
- Mute
- Subscribe to RSS Feed
- Permalink
- Report to a Moderator
Have you tried taking some LabVIEW tutorials or reading the documentation for a Waveform Chart? You makes lots of posts asking the basics about LabVIEW...
04-05-2016 06:50 AM
- Mark as New
- Bookmark
- Subscribe
- Mute
- Subscribe to RSS Feed
- Permalink
- Report to a Moderator
Here is extract from Help:
Wire a 2D array data type to the chart, right-click the chart, and select Transpose Array from the shortcut menu to treat each row in the array as a single plot.
Doesn't work. There is error in this instruction.
Solution: instead of right-click on Waveform chart one should insert Transpose Array block between Build Array block and Waveform chart.
04-05-2016 06:58 AM
- Mark as New
- Bookmark
- Subscribe
- Mute
- Subscribe to RSS Feed
- Permalink
- Report to a Moderator
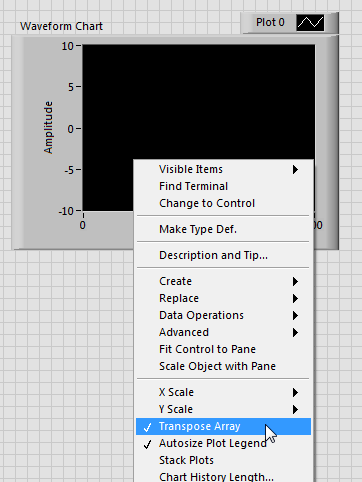
No, the help is correct, when you wire a 2D array to the waveform graph, you can transpose it from the shortcut menu as follows:
Ticking/unticking that option has the same effect as putting a Transpose 2D array before wiring your array into the waveform chart.
04-05-2016 07:07 AM
- Mark as New
- Bookmark
- Subscribe
- Mute
- Subscribe to RSS Feed
- Permalink
- Report to a Moderator
Yes...
I've tried on Block Diagram - there is no such option on Waveform chart context menu.
One more trap of LabVIEW - context menu changes depending on where it is called - in BlcokDiagram or in Front panel.
Thanks anyway.
04-05-2016 12:28 PM
- Mark as New
- Bookmark
- Subscribe
- Mute
- Subscribe to RSS Feed
- Permalink
- Report to a Moderator
You could use "build waveform" for each of the 1-d arrays. make sure you set the "dt" to the right value and THEN build an array of the two WFs. present that to the chart.
Ben

