- Subscribe to RSS Feed
- Mark Topic as New
- Mark Topic as Read
- Float this Topic for Current User
- Bookmark
- Subscribe
- Mute
- Printer Friendly Page
Dynamically control plot number of stack waveform chart
04-04-2016 02:18 AM
- Mark as New
- Bookmark
- Subscribe
- Mute
- Subscribe to RSS Feed
- Permalink
- Report to a Moderator
Hello,
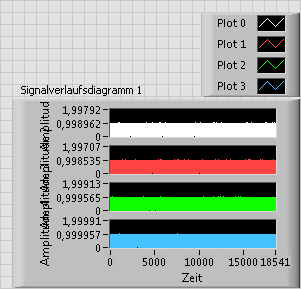
I want to use the waveform chart diagramm in stacked view:
In a simple example I cluster the signals and wire them to the chart diagramm ( - 3b.) data preparation chart diagramm):
Is there a way to dynamically change the number of shown plots in the stacked waveform chart?
Thanks a lot and best regards,
Michael
04-04-2016 07:06 AM
- Mark as New
- Bookmark
- Subscribe
- Mute
- Subscribe to RSS Feed
- Permalink
- Report to a Moderator
I don't know way to change plots number, but here is way to hide some lines.
But if you change array size, chart will redrawn.
04-04-2016 07:47 AM
- Mark as New
- Bookmark
- Subscribe
- Mute
- Subscribe to RSS Feed
- Permalink
- Report to a Moderator
Did you try uisng an array of WF datatypes?
Clusters can only be re-sized at development time.
Ben
04-11-2016 08:52 AM
- Mark as New
- Bookmark
- Subscribe
- Mute
- Subscribe to RSS Feed
- Permalink
- Report to a Moderator
@Ben wrote:Did you try uisng an array of WF datatypes?
Is there an example for that? I tried, but the result was not a plotted line, just many dots.


