- Subscribe to RSS Feed
- Mark Topic as New
- Mark Topic as Read
- Float this Topic for Current User
- Bookmark
- Subscribe
- Mute
- Printer Friendly Page
How to create an histogram?
04-11-2016 05:52 AM
- Mark as New
- Bookmark
- Subscribe
- Mute
- Subscribe to RSS Feed
- Permalink
- Report to a Moderator
I want to create an histogram where in the y axis there are the values that i Calculate and on the x axis there is the count of the value. For example in the y axis i have: average 1= 10, average 2=8, average3= 15. I want to create an histogram where in the y axis there are the values 10 , 8 , 15 and in the x axis the correspondant item : average1 or simply1, average2 or simply2, average3 or simply 3. HELP
04-11-2016 06:42 AM
- Mark as New
- Bookmark
- Subscribe
- Mute
- Subscribe to RSS Feed
- Permalink
- Report to a Moderator
Hi Robbie,
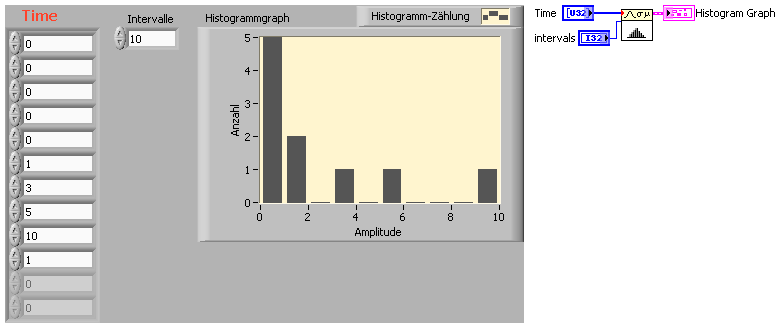
did you ever had a look at the Mathematics->Probability function palette? There are ready-to-use functions which provide histograms:
Also refer to these below links for help.
Histogram VI Help Page - http://zone.ni.com/reference/en-XX/help/371361H-01/gmath/histogram_discrete/
Using the Create Histogram Express VI - http://digital.ni.com/public.nsf/allkb/248CD14CD6C53D7986256D190058FD32
Hope this helps.
Kudos are Welcome 😄
Best LabVIEW Programmer @NIDAYS 2015
04-11-2016 07:46 AM - edited 04-11-2016 07:46 AM
- Mark as New
- Bookmark
- Subscribe
- Mute
- Subscribe to RSS Feed
- Permalink
- Report to a Moderator
Also launc the Example Finder by going to Help >> Find Examples then search Historgram and several examples come up showing how to make one, using graphs, or even 2D picture controls.
Unofficial Forum Rules and Guidelines
Get going with G! - LabVIEW Wiki.
17 Part Blog on Automotive CAN bus. - Hooovahh - LabVIEW Overlord


