- Subscribe to RSS Feed
- Mark Topic as New
- Mark Topic as Read
- Float this Topic for Current User
- Bookmark
- Subscribe
- Mute
- Printer Friendly Page
How to plot a multiple XY graph showing the area between the curves as shaded (colored)
10-25-2007 04:47 AM
- Mark as New
- Bookmark
- Subscribe
- Mute
- Subscribe to RSS Feed
- Permalink
- Report to a Moderator
Thanks in advance for your help.
10-25-2007 05:25 AM - edited 10-25-2007 05:25 AM
- Mark as New
- Bookmark
- Subscribe
- Mute
- Subscribe to RSS Feed
- Permalink
- Report to a Moderator
Use the Fill Base Line option in the pop-up menu attached to the graph legend, and select the the curve to be used as "base line"
See the attached picture

Message Edité par chilly charly le 10-25-2007 12:26 PM
10-25-2007 05:43 AM
- Mark as New
- Bookmark
- Subscribe
- Mute
- Subscribe to RSS Feed
- Permalink
- Report to a Moderator
10-25-2007 05:46 AM - edited 10-25-2007 05:46 AM
- Mark as New
- Bookmark
- Subscribe
- Mute
- Subscribe to RSS Feed
- Permalink
- Report to a Moderator
That was quick isn't it ?
You can achieve the same result programmatically, using the proper property nodes. First select the active plot, then define the
associated plot to fill to. Additionnally, you can select a different color for the curves and the filled region : While selecting the color, press the space bar to select the curve color, the background color or both.
Enjoy.

Message Edité par chilly charly le 10-25-2007 12:47 PM
10-25-2007 06:44 AM - edited 10-25-2007 06:44 AM
- Mark as New
- Bookmark
- Subscribe
- Mute
- Subscribe to RSS Feed
- Permalink
- Report to a Moderator
That was too quick !
Your example is significantly more complicated, since there are some boolean logic behind.
I'm not sure this is something that can be done easily with LabVIEW. After some play with the drawing order of the various curves, I have been able to reproduce your example, but that's not very elegant :
Plots 0 and 1 are duplicates of plots 4 and 5 to improve the drawing (without these additionnal plots, the red and black lines almost disapear, hidden by the inter-curve filling). Line 2 fills to Line 5 (green to red in white). Line 3 fills to Line 4 (black to blue, in grey).
May be someone will comes with a better solution. Ben ?

Message Edité par chilly charly le 10-25-2007 01:45 PM
10-25-2007 07:52 AM
- Mark as New
- Bookmark
- Subscribe
- Mute
- Subscribe to RSS Feed
- Permalink
- Report to a Moderator
The "Graph Master" is asking me!
I have to go look at getting a driver running under RT so I can't play right now, but...
If you have an off-screen graph that defines the background, you can do an invoke node get image and insert it as of of the image layers of the graph. That way the graph and all of the plots are not affected by the background graphic stuff.
I used a similar technique to add the circles to this image
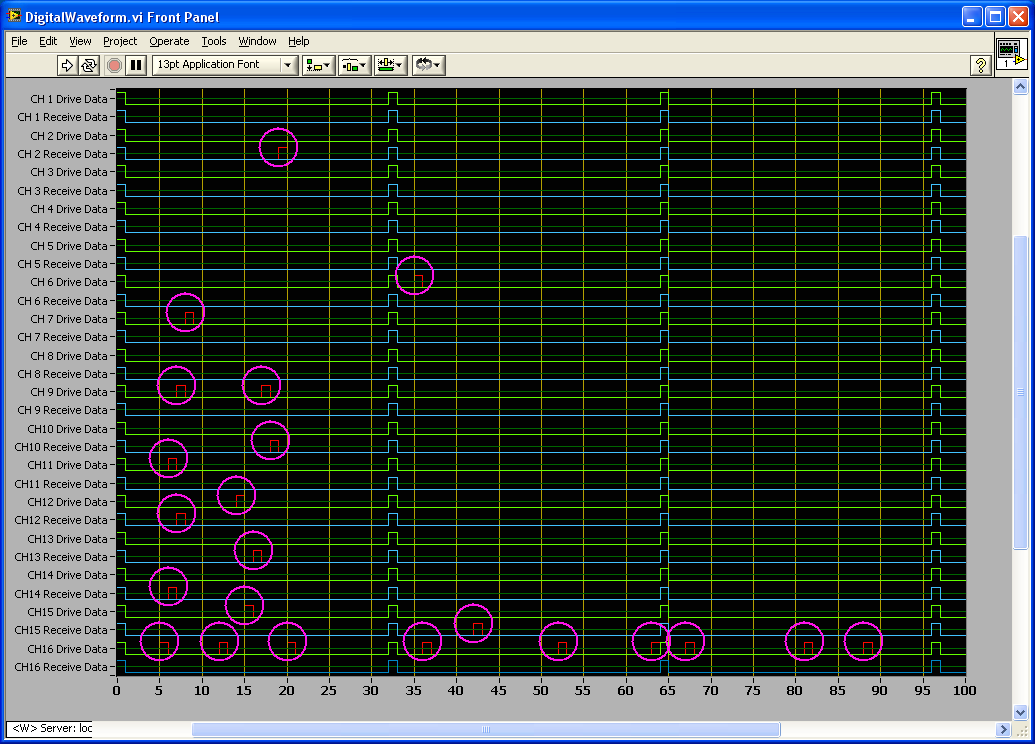
that was aprt of this thread.
Ben
10-25-2007 08:03 AM
- Mark as New
- Bookmark
- Subscribe
- Mute
- Subscribe to RSS Feed
- Permalink
- Report to a Moderator
I can see my favourite bear has very sensitive ears... 🙂
I'll have a look at this image layer stuff. Thanks Ben !
10-25-2007 08:19 AM
- Mark as New
- Bookmark
- Subscribe
- Mute
- Subscribe to RSS Feed
- Permalink
- Report to a Moderator
