- Subscribe to RSS Feed
- Mark Topic as New
- Mark Topic as Read
- Float this Topic for Current User
- Bookmark
- Subscribe
- Mute
- Printer Friendly Page
Waveform Chart Clears automatically
Solved!04-17-2024 11:37 PM
- Mark as New
- Bookmark
- Subscribe
- Mute
- Subscribe to RSS Feed
- Permalink
- Report to a Moderator
Hi,
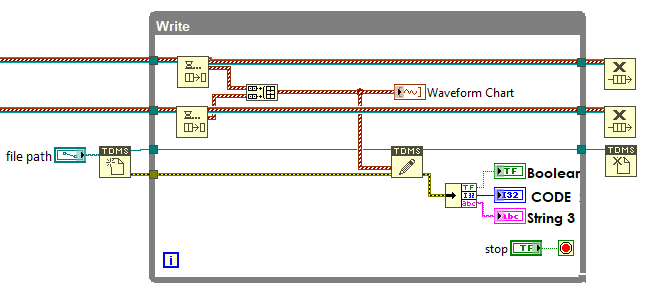
My application created using LabVIEW collects data from DAQ (8 Channels) and CNC Controller (8 Channels) at a pace of 5 data per second and logs it simultaneously to a tdms file. I have a waveform chart which displays the data taken from all the 16 channels. But for some reason this chart clears itself at random intervals. Requesting someone to help me solve this issue.
Thanks.
Solved! Go to Solution.
04-17-2024 11:52 PM
- Mark as New
- Bookmark
- Subscribe
- Mute
- Subscribe to RSS Feed
- Permalink
- Report to a Moderator
We cannot tell what you are doing wrong unless you show us what you are doing. Please attach a simplified VI that demonstrates the problem with simulated data so we don't need your hardware.
04-18-2024 02:22 AM
- Mark as New
- Bookmark
- Subscribe
- Mute
- Subscribe to RSS Feed
- Permalink
- Report to a Moderator
I have attached the VI. Please have a glance. Also, I think it might work well as the problem that I stated has an erratic behavior.
04-18-2024 05:39 AM
- Mark as New
- Bookmark
- Subscribe
- Mute
- Subscribe to RSS Feed
- Permalink
- Report to a Moderator
The waveform chart will clear if the number of waveforms changes or if the waveforms overlap from one iteration to the next.
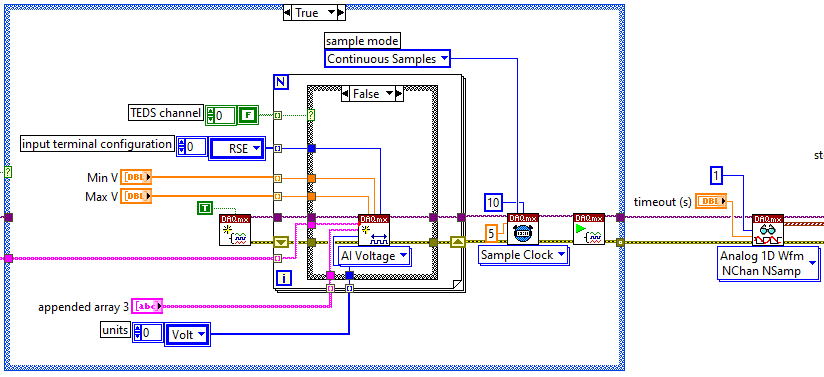
My guess is that you are reading too fast and DAQmx Read occasionally returns an empty array of waveforms. Does it go away if you wire 1 to the number of samples per channel? You should remove Wait until next ms multiple.
Your code could be made a lot more readable:
- merge the case structures that prepare the data acquisition into a single one
- In the second loop you can build an array of the data and use a for loop to build the waveforms.
Most importantly, you should have a way to properly shut down the application. Otherwise you might corrupt your TDMS file. You could wire the queue error outputs to the conditional terminal. To stop, release the queues.
04-19-2024 04:22 AM
- Mark as New
- Bookmark
- Subscribe
- Mute
- Subscribe to RSS Feed
- Permalink
- Report to a Moderator
Thanks for your response. I used the VI snippets that you sent and compiled them to make an application. I did not encounter the problem that I mentioned (Clearing of Wfm Chart) but I can observe the second loop (Data collection from CNC controller) runs slower than the first one (DAQ device data collection). Second loop gradually slows down and an hour it has run 25 loops lesser than the first loop. Requesting to provide solution or possible causes for this.
04-19-2024 09:49 AM
- Mark as New
- Bookmark
- Subscribe
- Mute
- Subscribe to RSS Feed
- Permalink
- Report to a Moderator
Does the upper loop run as fast as you expect? If so, the cnc absolute VI may occasionally take longer than 200 ms to execute. Did you check by displaying the number of enqueued elements?
I forgot to mention that the cnc data will all be written to the same channel in the TDMS file. You need to assign unique channel names to separate them.
04-22-2024 03:58 AM - edited 04-22-2024 03:58 AM
- Mark as New
- Bookmark
- Subscribe
- Mute
- Subscribe to RSS Feed
- Permalink
- Report to a Moderator
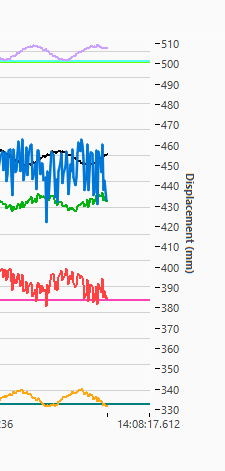
As you can see in the below screenshot which is a section of waveform chart mentioned in the code has a lag after running for 4 hours. Here the flat line denotes data from CNC controller and waves denote data from DAQ. I also placed a Get Queue Status function to get the number of elements in the queue for both the queues and found out DAQ loop is slower showing 32 elements in the queue after 4 hours while the CNC controller data queue remains 0 and rarely goes to 1 at times.
Regarding unique channel names, I corrected it.
04-22-2024 05:15 AM
- Mark as New
- Bookmark
- Subscribe
- Mute
- Subscribe to RSS Feed
- Permalink
- Report to a Moderator
If the DAQ queue has more elements in it that means it is producing data faster than the other loop. You can check the waveform dt to get the actual sampling rate.
If you want to keep the current setup, you need to occasionally request more than one sample from DAQmx Read, the Waveform Chart can handle varying lengths. If the queue is not empty, read two samples, if it is empty, read one. Seems a little suspicious to be honest, but it might work for you.
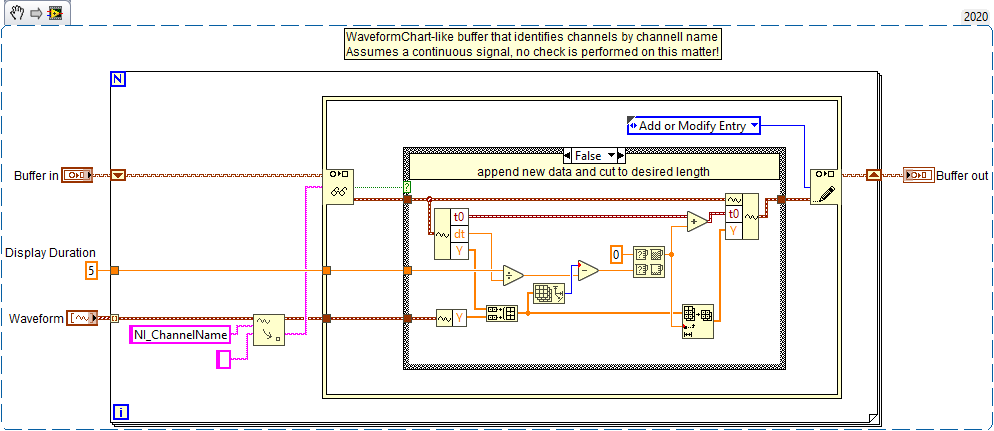
Otherwise, you need to enqueue data into a single queue and roll your own Waveform Chart buffer that identifies channels by their name. Then use a waveform chart to plot your data. You will not have the same funcitonality as with a waveform chart, but it might be enough for you.
Here is a starting point:


