- Subscribe to RSS Feed
- Mark Topic as New
- Mark Topic as Read
- Float this Topic for Current User
- Bookmark
- Subscribe
- Mute
- Printer Friendly Page
Waveform Chart Displaying unwanted Points
Solved!12-10-2018 08:51 AM
- Mark as New
- Bookmark
- Subscribe
- Mute
- Subscribe to RSS Feed
- Permalink
- Report to a Moderator
Hello!
I am using a waveform chart to display temperature data and as soon as the plots are at the right side of the graph, dots appear at the left side, which correspond to the most recent point plotted on the right (circled in red in the picture). This only happens, when the window of the graph is scrollable. If there is still space on the graph the dots don't appear.
Has anyone experienced a same thing or know how to fix this?
I am using LabView 2017 SP1 on a windows machine. Furthermore I am changing the range of the scale programmatically using value properties.
Thank you for your help!
Solved! Go to Solution.
12-10-2018 09:55 AM - edited 12-10-2018 09:56 AM
- Mark as New
- Bookmark
- Subscribe
- Mute
- Subscribe to RSS Feed
- Permalink
- Report to a Moderator
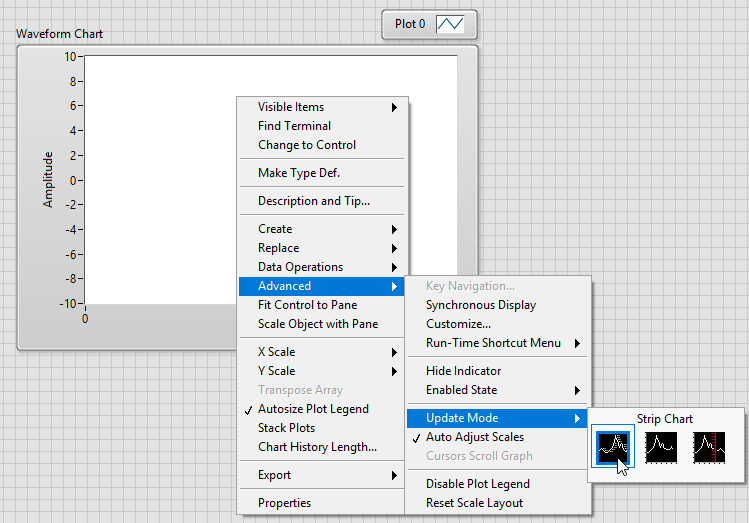
Try this-
Does the plot continue to overwrite across the length of the screen? Or do the dots just show up at the left and stick there?
Post your code if the above doesn't work (preferably in v2016)
12-10-2018 10:31 AM
- Mark as New
- Bookmark
- Subscribe
- Mute
- Subscribe to RSS Feed
- Permalink
- Report to a Moderator
Thank you for your reply!
It is already set to "Strip Chart" update mode.
It is difficult to share the code since it is only a SubVI.
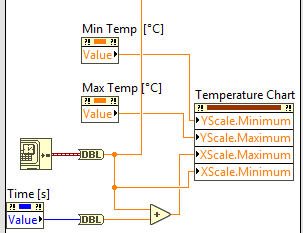
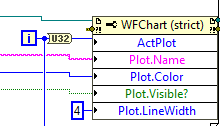
I do a few modifications to the plots and the axis.
Initially I set the maximum and minimum of the axis.
On the plots I set these specifications. I just discovered, that if I set the line width to 1 the dots don't appear. Maybe this could just be because one can't see them. However if it is set to 2 or more the dots appear.
Have you experienced something similar? Or might this be a bug from LabView?
Thank you for your help!
12-10-2018 11:23 AM - edited 12-10-2018 12:30 PM
- Mark as New
- Bookmark
- Subscribe
- Mute
- Subscribe to RSS Feed
- Permalink
- Report to a Moderator
@jhuwyler wrote:Have you experienced something similar?
It is a cosmetic problem and has been there forever.
(... and why would you need all these value properties? Seems completely wrong...and why would you set xmin to the current time??)
12-11-2018 07:48 AM
- Mark as New
- Bookmark
- Subscribe
- Mute
- Subscribe to RSS Feed
- Permalink
- Report to a Moderator
Alright then I can't do much about it.
Thank you for your help!
I set so many properties because I have a manual range controller and want to set the start and endpoint of the x-axis right. Also I have previously custom set channel names and colors.
12-11-2018 10:43 AM
- Mark as New
- Bookmark
- Subscribe
- Mute
- Subscribe to RSS Feed
- Permalink
- Report to a Moderator
@jhuwyler wrote:
I set so many properties because I have a manual range controller and want to set the start and endpoint of the x-axis right.
Typically one would wire to the terminal directly and if that is not possible use a local variable. (Value properties are significantly more expensive and there is no reason here to use three of them)
Hard to tell what else is going without seeing more of the code. How does that tiny code fragment fit in the rest of the program? How often is it called? Does the data have time information (waveform, dynamic) or not (scalar, array, cluster, etc.). Do you set x0, dx somewhere?


