Turn on suggestions
Auto-suggest helps you quickly narrow down your search results by suggesting possible matches as you type.
Showing results for
Topic Options
- Subscribe to RSS Feed
- Mark Topic as New
- Mark Topic as Read
- Float this Topic for Current User
- Bookmark
- Subscribe
- Mute
- Printer Friendly Page
XY graph Y axis range
Solved!
Member
03-06-2023 01:21 PM
Options
- Mark as New
- Bookmark
- Subscribe
- Mute
- Subscribe to RSS Feed
- Permalink
- Report to a Moderator
Labels:
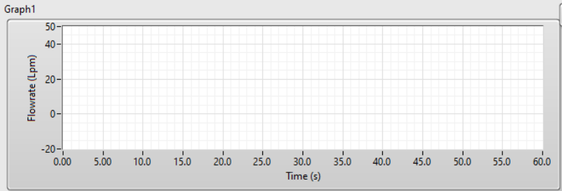
I programmatically set the min and max on the y axis, and x range of an XY Graph. Before starting the VI the y axis looks correct (see below) with min and max of -20 and 50, respectively.
However, after I start the vi and xy points are generated the y axis min max change based on the data min max of the plotted data (see below).
How can I fix this behavior?
Girish
Solved! Go to Solution.
Solution
Accepted by topic author girish53
Trusted Enthusiast
03-06-2023 01:28 PM
Options
- Mark as New
- Bookmark
- Subscribe
- Mute
- Subscribe to RSS Feed
- Permalink
- Report to a Moderator
Have you turned off Autoscale?


