- Subscribe to RSS Feed
- Mark Topic as New
- Mark Topic as Read
- Float this Topic for Current User
- Bookmark
- Subscribe
- Mute
- Printer Friendly Page
scan from string
Solved!04-05-2016 02:34 AM
- Mark as New
- Bookmark
- Subscribe
- Mute
- Subscribe to RSS Feed
- Permalink
- Report to a Moderator
Hi,
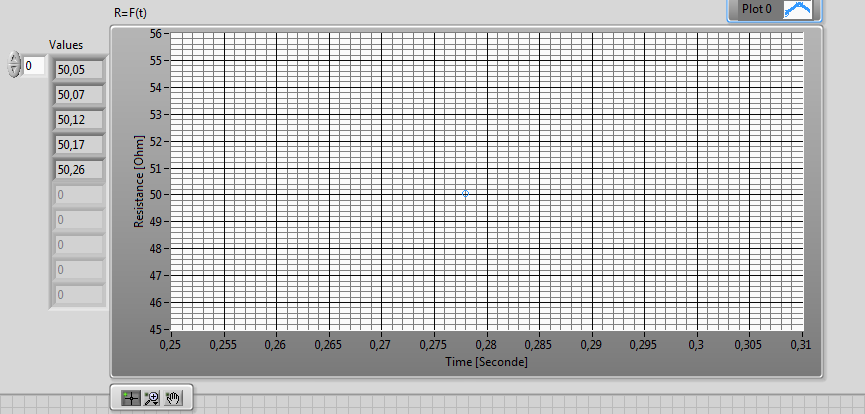
I want to display values that I am reading from an instrument via a serial port in a graph xy in function of real time.. But I dont know why it's only displaying the last value not plotting the whole curve.
you will find attached the programm
any suggestions?
Solved! Go to Solution.
04-05-2016
03:20 AM
- last edited on
12-10-2024
04:45 PM
by
![]() Content Cleaner
Content Cleaner
- Mark as New
- Bookmark
- Subscribe
- Mute
- Subscribe to RSS Feed
- Permalink
- Report to a Moderator
You do not understand the difference between Graph and Chart. A Graph in LabVIEW will ONLY plot the data what is connected to it, and it will erase all old data at the next iteration. A Chart has a "memory", by default 1024 data points are stored. Try to use a chart...
edit:
I had a look at your VI. Some advices:
- Learn how to use a proper State Machine. This VI has many problems which a state machine can easily solve...
- Flat Sequence Structure: Do NOT use it! Think about the Data Flow principle! You clearly do not understand how LabVIEW works. You have for example the Start/Stop combo box: its value will be read ONLY once, and after when you are in the FOR loop, it has no effect any more.
- No error handling is implemented.
- I see now you try to use a Feedback node to build up your data XY curve. This is a potential memory leak depending on how long you run your code... Also, you will not able to see more pixels on the Graph than the pixel size of the Graph. You should handle this.
I advice you to take the free online courses, also have a look at the following page:
http://www.ni.com/newsletter/51735/en/
04-05-2016 03:32 AM - edited 04-05-2016 03:38 AM
- Mark as New
- Bookmark
- Subscribe
- Mute
- Subscribe to RSS Feed
- Permalink
- Report to a Moderator
but when I am using a chart I cannot have the exact time when I am reading. I am having an error of connexion when I am doing it (I am connecting two terminal of different type)
I actually need to plot R=f(t) so I have two axes X (resistance) and Y(real time)
I didn't understand your answer honestly
I am also taking the free courses 🙂 . thank you for your advises. Do you have any suggestions to make it work?
04-05-2016 03:36 AM - edited 04-05-2016 03:37 AM
- Mark as New
- Bookmark
- Subscribe
- Mute
- Subscribe to RSS Feed
- Permalink
- Report to a Moderator
I didn't understand your answer honestly
That is why you should take some (online) courses in LabVIEW. You do things in your VI which clearly shows you do not understand basic principles. First you should learn a bit deeper LV, so it is easier to help.
It just does not make sense to explain these bugs in your code, since these things are discussed in the beginner tutorials. Like when you connect a control to a FOR loop, and you expect that when you change the value of the control it will take any effect inside the running FOR loop. This means you do not understand data flow. Take the tutorials and learn.
04-05-2016 03:44 AM - edited 04-05-2016 03:46 AM
- Mark as New
- Bookmark
- Subscribe
- Mute
- Subscribe to RSS Feed
- Permalink
- Report to a Moderator
I think it's actually you who didn't understand the program 🙂 .
the for loop is for precising how many values do I want to read. It's a program to read the internal resistance of motor when it's cold or hot.
like if I need 7 values he will repeat reading 7 times
it's actually was working really good and stable. but it was just indexing +1 in the time instead of real time.
and since I added the XY graph and the bundle I got this problem 🙂 so if you have an idea it would be nice 🙂
04-05-2016 05:12 AM - edited 04-05-2016 05:12 AM
- Mark as New
- Bookmark
- Subscribe
- Mute
- Subscribe to RSS Feed
- Permalink
- Report to a Moderator
It looks like your issue is your Divide for the time. Your are dividing by an array with 1 element. Therefore, you will only have 1 X value. Instead, divide by a numeric scaler and that divisor will be applied to every element in the array.
But a better way is to only do the math once per iteration (instead of once for ever element every iteration).

There are only two ways to tell somebody thanks: Kudos and Marked Solutions
Unofficial Forum Rules and Guidelines
"Not that we are sufficient in ourselves to claim anything as coming from us, but our sufficiency is from God" - 2 Corinthians 3:5


