- Subscribe to RSS Feed
- Mark Topic as New
- Mark Topic as Read
- Float this Topic for Current User
- Bookmark
- Subscribe
- Mute
- Printer Friendly Page
Unexpected behavior in PlotXY with Xdata of type VAL_DOUBLE and Ydata of type VAL_SSIZE_T and graph type VAL_VERTICAL_BAR when Ydata is negative
Solved!02-22-2022 05:28 PM
- Mark as New
- Bookmark
- Subscribe
- Mute
- Subscribe to RSS Feed
- Permalink
- Report to a Moderator
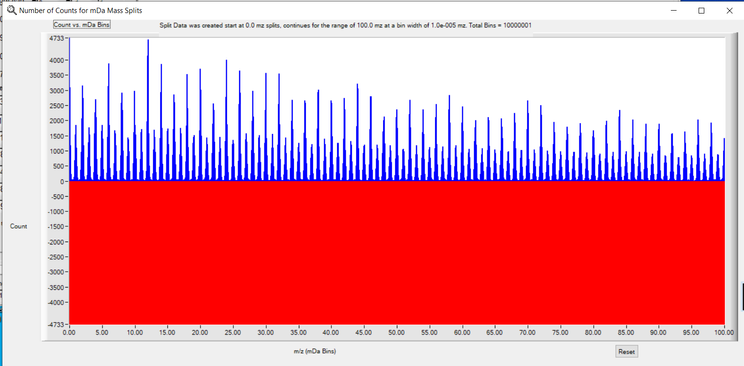
I have an application where I want to compare to sets of data with a butterfly plot. Dataset1 is all positive data in one color and Dataset 2 is also positive data but for the purpose of this plot is converted to negative values and plotted red. If I use the same data for both datasets as a test I expect to see mirror images above and below the line. I see the positive value correctly. I see unexpected results for the negative values. (solid red from the largest negative value for the dataset to zero on the y axis for every single x value. See image below.
The code that generates to the plots is below.
plotHandle1 = PlotXY (splitHandle, SPLITS_GRAPH, mzSplitArray, binArray1, totalBinCount, VAL_DOUBLE, VAL_SSIZE_T, VAL_VERTICAL_BAR, VAL_NO_POINT, VAL_SOLID, 1, VAL_BLUE);
plotHandle2 = PlotXY (splitHandle, SPLITS_GRAPH, mzSplitArray, binArray2, totalBinCount, VAL_DOUBLE, VAL_SSIZE_T, VAL_VERTICAL_BAR, VAL_NO_POINT, VAL_SOLID, 1, VAL_RED);
If I debug in array view I get this for the "blue" data.
Similarly, if i debug Array View the red data, I get this.
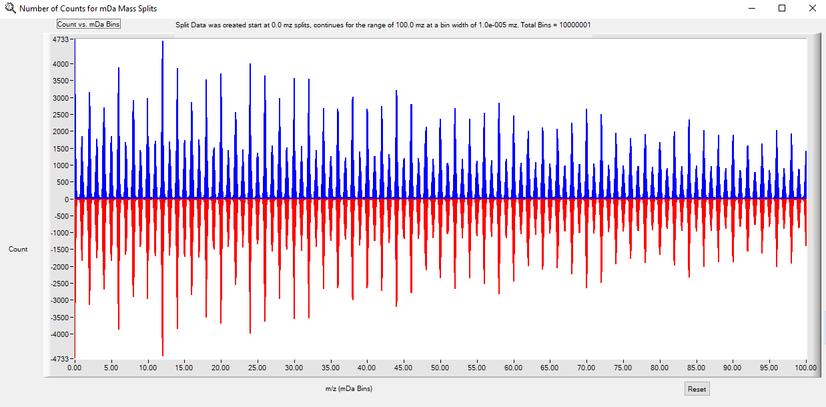
I was expecting to see this kind of peak structure for both of the plots. I assume that this is a bug but I wondered if anyone can recreate the results.
Windows 10, LabWindows /CVI Full Development System 20.0.0 Version 49252
Solved! Go to Solution.
02-23-2022 01:24 AM
- Mark as New
- Bookmark
- Subscribe
- Mute
- Subscribe to RSS Feed
- Permalink
- Report to a Moderator
VAL_SSIZE_T is signed (VAL_SIZE_T isn't), but its size is dependent on the compiler bitness: 4 bytes on 32-bits, 8 on 64-bits.
02-23-2022 02:57 AM
- Mark as New
- Bookmark
- Subscribe
- Mute
- Subscribe to RSS Feed
- Permalink
- Report to a Moderator
the array view does not use vertical bars, that's why it looks o.k.
You might try VAL_BASE_ZERO_VERTICAL_BAR instead
02-23-2022 08:35 AM - edited 02-23-2022 08:38 AM
- Mark as New
- Bookmark
- Subscribe
- Mute
- Subscribe to RSS Feed
- Permalink
- Report to a Moderator
Thanks for both of the comments. I should have added the following
ssize_t *binArray1;
ssize_t *binArray2;
I recognized that array view was plotting by its own rules just wanted y'all to see the expected result. I had not thought of the option for multiple types of vertical bars to be present. Apologies for wasting some of your time.
When I switched to the PlotXY types to VAL_BASE_ZERO_VERTICAL_BAR I got the expected results
plotHandle1 = PlotXY (splitHandle, SPLITS_GRAPH, mzSplitArray, binArray1, totalBinCount, VAL_DOUBLE, VAL_SSIZE_T, VAL_BASE_ZERO_VERTICAL_BAR, VAL_NO_POINT, VAL_SOLID, 1, VAL_BLUE);
plotHandle2 = PlotXY (splitHandle, SPLITS_GRAPH, mzSplitArray, binArray2, totalBinCount, VAL_DOUBLE, VAL_SSIZE_T, VAL_BASE_ZERO_VERTICAL_BAR, VAL_NO_POINT, VAL_SOLID, 1, VAL_RED);


