- Subscribe to RSS Feed
- Mark Topic as New
- Mark Topic as Read
- Float this Topic for Current User
- Bookmark
- Subscribe
- Mute
- Printer Friendly Page
Saw tooth Wave analysis
Solved!04-01-2016 09:37 AM
- Mark as New
- Bookmark
- Subscribe
- Mute
- Subscribe to RSS Feed
- Permalink
- Report to a Moderator
Morning~
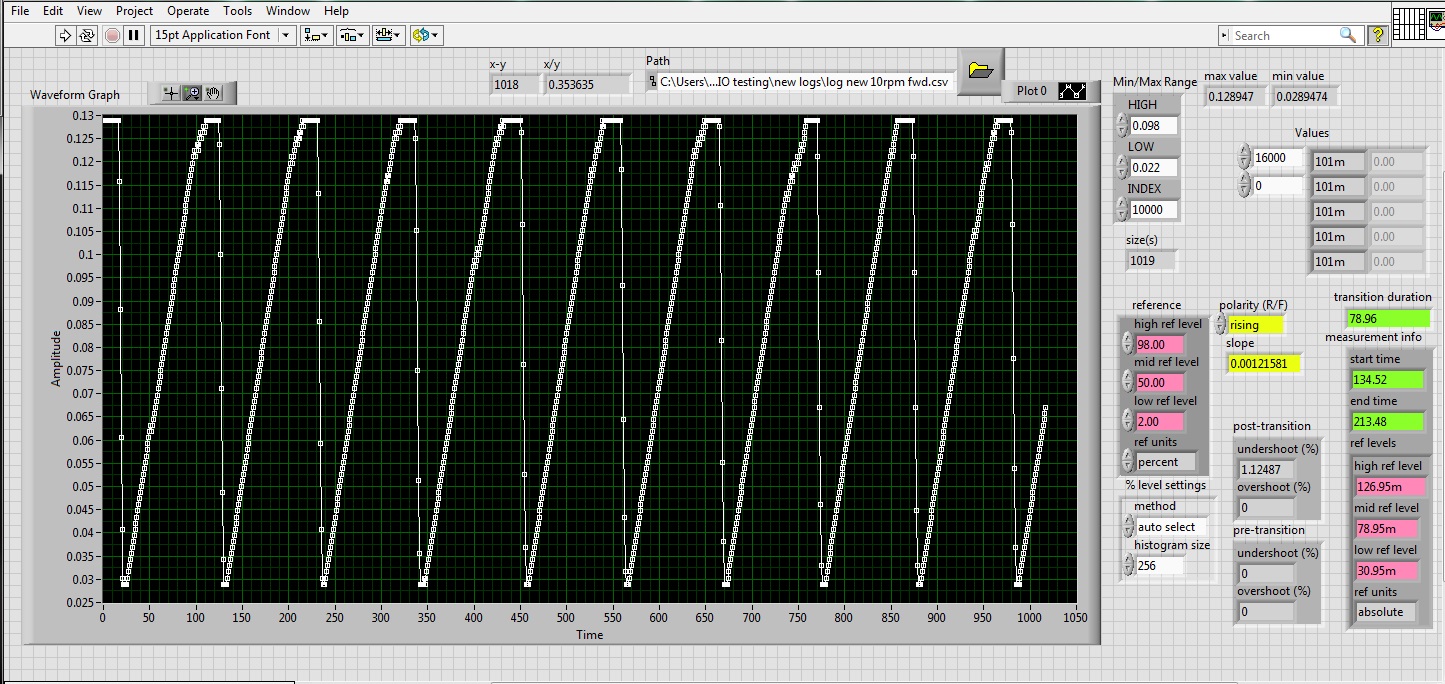
I am working on a project to read a variable input eddy current sensor and see it as a waveform. The profile of the rotating object that we are detecting is such that it creates a saw tooth pattern. What I am trying to accomplish with this is to create a specific drop off point with a constant value that can be seen on the waveform. I need to be able to have this value stay the same at any rpm up to 60rpm.
I can generate the front slope to a specific known window - but I cannot figure out how to insert a constant value into the waveform in place of the drop.
I have included the program and the actual recorded files so you can play with them. It is important for me to be able to create that drop when the sensor reads the point of drop with a known constant.
Any Ideas?
Solved! Go to Solution.
04-01-2016 04:03 PM
- Mark as New
- Bookmark
- Subscribe
- Mute
- Subscribe to RSS Feed
- Permalink
- Report to a Moderator
OK I played around with the code a bit so use this vi instead of the one in the zip file.
This does what I need it to do to in order to isolate the fall off point but I still need to replace that drop with a static number so it creates a straight drop.
Anyway, thanks.
04-04-2016 10:20 AM
- Mark as New
- Bookmark
- Subscribe
- Mute
- Subscribe to RSS Feed
- Permalink
- Report to a Moderator
Hey Gearmeister,
Given that LabVIEW generates these kinds of waveforms by doing mathematical manipulations to arrays of horizontal-axis data, it's not going to be possible to achieve your desired functionality using a standard mathematical function. This array-based system essentially eliminates perfectly vertical lines in time-functions in LabVIEW. Even writing a repeating ramp function that drops vertically back down to a baseline after ramping will cause some problems. If you want a graphical vertical line, you could look into Cursors.
Ultimately, LabVIEW is programmed this way because it makes much more sense from a processing/memory perspective and that it mirrors physical systems, which require some amount of time (potentially, very small) to change. I can't imagine the application here would change immediately; can you explain the importance of this vertical line in your application? If we can better understand your desired end functionality, perhaps forum users will be better able to help you out.
04-05-2016 06:40 AM
- Mark as New
- Bookmark
- Subscribe
- Mute
- Subscribe to RSS Feed
- Permalink
- Report to a Moderator
Thanks for the response Matt.
I think I was not clear before, as the vertical line is ok to transition over time but it just needs to be as vertial as possible. I am trying to measure distance from the end of the eddy current sensor on a single helical coil that intersects itself. (basically draw a circle with a decreasing radius, where the circumfrence does not meet at the same start/stop point ant draw a vertical line to connect the two open ends together). I am trying to use the upset to measure rpm, which it does. The problem comes in when the eddy sensor lands on that upset at stop and I get hundreds of varying readings (all within the range of the hieght of the profile) so LabVIEW cannot determine if I am stopped or going really fast.
So I would like to insert a constant into the wave profile there and ignore the sensor until I start rotating again. Or figure out a way to generate a duplicate waveform and set it as an out of phase comparison for a reference without having to use two sensors.
04-06-2016 08:38 AM
- Mark as New
- Bookmark
- Subscribe
- Mute
- Subscribe to RSS Feed
- Permalink
- Report to a Moderator
So you're acquiring data from the sensor (which is displayed in the graph in your first post) and want to also write your own data - in the form of a vertical line - to that same graph in specific locations?
I just ask because I'm still not sure I completely understand what you're trying to accomplish here. Is it the low-amplitude part of your data that is skewing your analysis?
04-12-2016 09:12 AM
- Mark as New
- Bookmark
- Subscribe
- Mute
- Subscribe to RSS Feed
- Permalink
- Report to a Moderator
Thanks for the patience, I was on vacation last week.
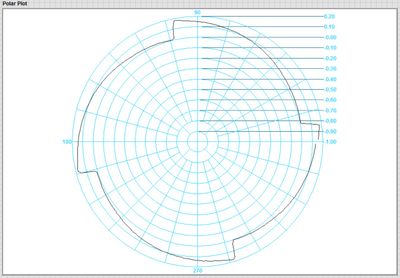
So the issue I am trying to correct is for the size of the sensor head on the eddy current sensor. As the edge profile passes in front of the sensor there is a point on the sensor head where it reads an inconsistent distance. this distance is interpreted as shown on the graph when you zoom in on a falling (or rising in reverse) edge. At slower revolution this falling edge grows over time to the point that the falling edge can look more like a sine wave than a sawtooth wave. This inconsistency is not good when in actuality it covers the same edge of the profile. Look at these two polar plots of the sawtooth to get an idea of what i am trying to correct via programming.
I am trying to program a consistent edge profile like the one on the right (high rpm) to insert into the profile on the left at slow rpm. Considering that the waveform generated comes from a constant 1-d array of numbers that are the measurement of the same profile over and over I was thinking about setting up an insert into array function that replaces that falling edge set of points two a constant two or three numbers... Anyway still playing with the numbers and the program.
Dunno if that helps or not...
04-13-2016 04:07 PM
- Mark as New
- Bookmark
- Subscribe
- Mute
- Subscribe to RSS Feed
- Permalink
- Report to a Moderator
It sounds like this behavior is based on some limitation of the eddy current sensor being used. Is the sensor sampling too quickly to make sense of the vertical face of the object being scanned while the object rotates at low rpm?
So the behavior is acceptible at high RPM because the eddy current sensor can only take one or two readings of the quickly-changing vertical face?
04-27-2016 09:28 AM
- Mark as New
- Bookmark
- Subscribe
- Mute
- Subscribe to RSS Feed
- Permalink
- Report to a Moderator
So I have been testing some different profiles on the test piece and selieve that the issue is a timing limitation within the cRIO card itself. The eddy sensor transmits data at 20,000 times a second (20khz) while the NI 9207 has a resolution in high speed mode of 2ms per channel and has to scan 16 channels before returning to the data from the sensor. So that roughly translates to a frequency of about 30 Hz from the card to the FPGA.
All that really means to me is that i should have a resolution of about 34 deg at 180 rpm and about 2 deg resolution at 10 rpm. However, I am only getting a best resolution of 16 deg at any rotational speed. So I am loosing data somewhere int the transition.
So thanks for the input. I am agreeing with yo that it a timing issue that needs to be resolved not a waveform correction.


