- Subscribe to RSS Feed
- Mark Topic as New
- Mark Topic as Read
- Float this Topic for Current User
- Bookmark
- Subscribe
- Mute
- Printer Friendly Page
intensity graph
02-24-2014 06:37 AM
- Mark as New
- Bookmark
- Subscribe
- Mute
- Subscribe to RSS Feed
- Permalink
- Report to a Moderator
hello
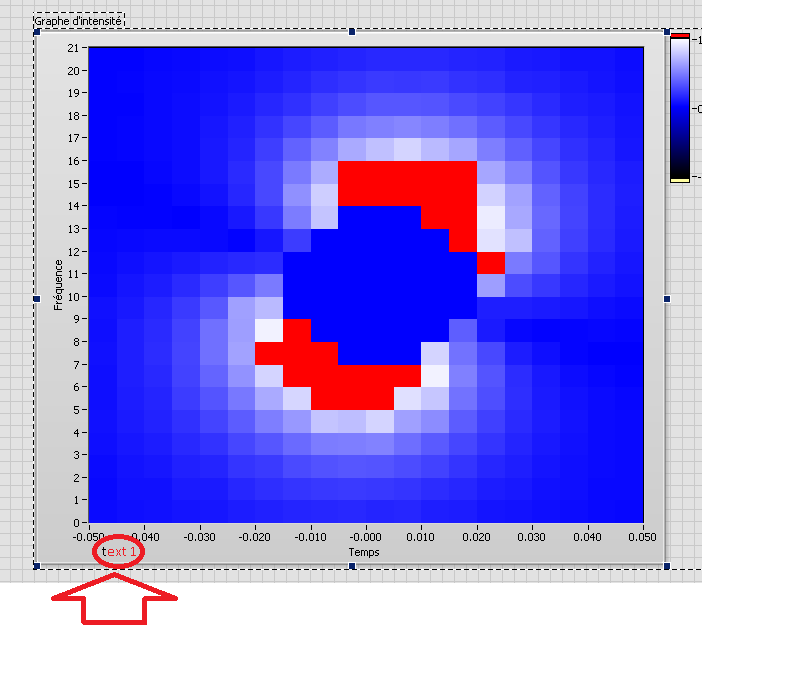
in a intensituy graph , I want place the scale text in the middle of the marker like excel

thanks a lot
02-24-2014 06:52 AM
- Mark as New
- Bookmark
- Subscribe
- Mute
- Subscribe to RSS Feed
- Permalink
- Report to a Moderator
02-24-2014 08:11 AM
- Mark as New
- Bookmark
- Subscribe
- Mute
- Subscribe to RSS Feed
- Permalink
- Report to a Moderator
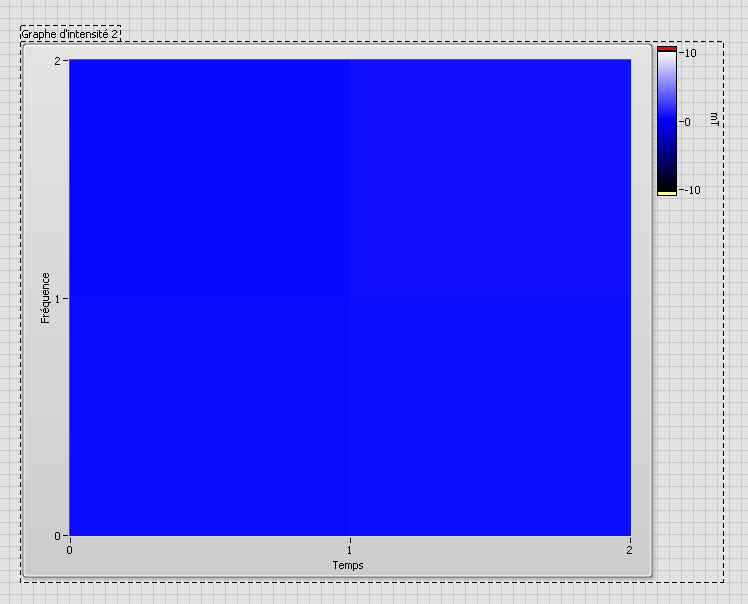
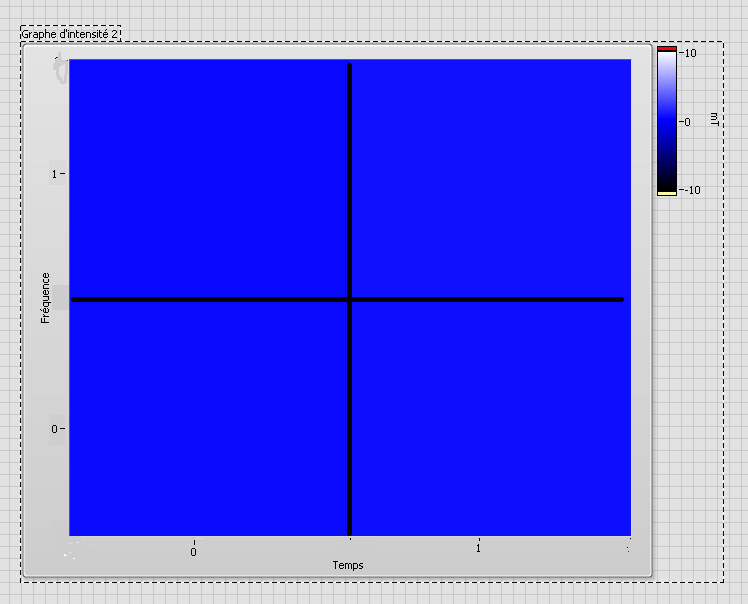
i' m sorry but i don't want fake the scale
i want put the marker in the middle of the scarre mesure like this

to

wathever the scale (2 or more).
thanks
02-24-2014 09:26 AM
- Mark as New
- Bookmark
- Subscribe
- Mute
- Subscribe to RSS Feed
- Permalink
- Report to a Moderator
Hi jerome,
you cannot put values in between the markers. That's a limitation of the current intensity graphs!
But I remember there was a related LabVIEW idea you can vote for! Please search on your own here!
