- Subscribe to RSS Feed
- Mark Topic as New
- Mark Topic as Read
- Float this Topic for Current User
- Bookmark
- Subscribe
- Mute
- Printer Friendly Page
Balloon Plots
Solved!03-08-2017 05:37 PM
- Mark as New
- Bookmark
- Subscribe
- Mute
- Subscribe to RSS Feed
- Permalink
- Report to a Moderator
altenbach shows us in https://forums.ni.com/t5/LabVIEW/How-to-plot-3D-surface-graph-from-X-Y-Z-points/m-p/2415192#M745940 how to plot a sphere on a 2012 style parametric 3d graph.
lots of trial and error later:


03-09-2017 03:04 PM
- Mark as New
- Bookmark
- Subscribe
- Mute
- Subscribe to RSS Feed
- Permalink
- Report to a Moderator
Looks best at "cartesian" and "surface-contour"

03-09-2017 06:11 PM
- Mark as New
- Bookmark
- Subscribe
- Mute
- Subscribe to RSS Feed
- Permalink
- Report to a Moderator
I don't think putting the vertical angles inside the inner loop is the right thing to do because we don't have the values of all the horizontal angles and the respective pressure level for all the vertical angles.
I converted my 1D array into 2D array by creating 1D arrays of all the values with the same vertical angle and then stiched them together. Attached is the result.
I see no data at around y=1.16 and I don't understand why.
Also, how do I change the color based the value of the radius(sound pressure level)? I want to view the colors like a heat map.
Thanks!
03-10-2017
03:31 AM
- last edited on
01-03-2025
06:39 PM
by
![]() Content Cleaner
Content Cleaner
- Mark as New
- Bookmark
- Subscribe
- Mute
- Subscribe to RSS Feed
- Permalink
- Report to a Moderator
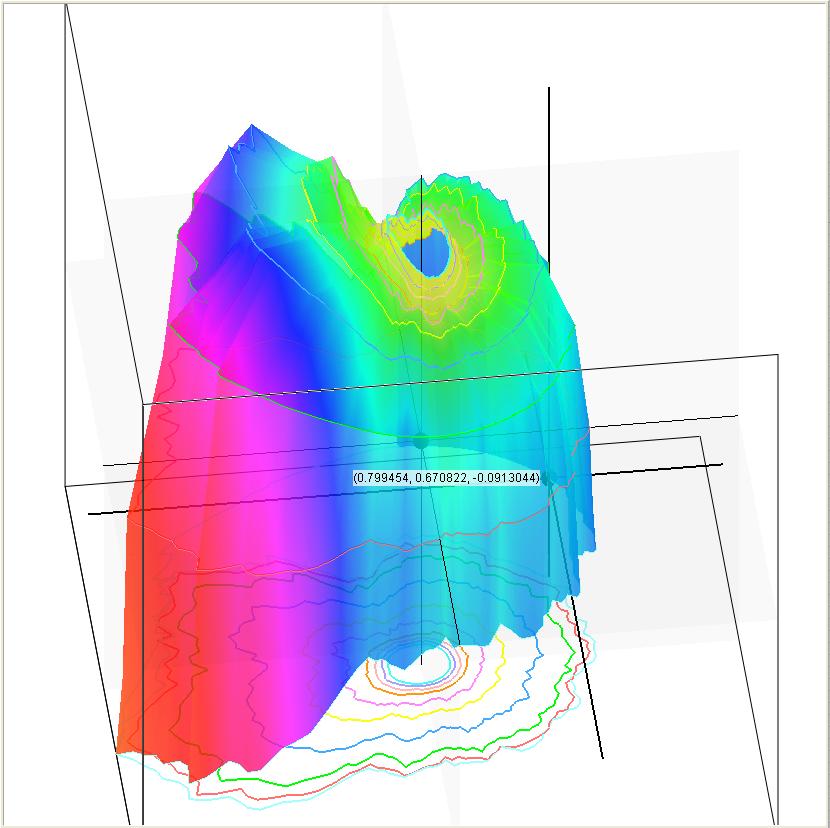
This zick-zack gap on the rendered surface looks odd, I guess we have to find a way to wrap it around completly.
I don't have a solution at hand, but I think this can't be to hard to solve.
Moreover, I can help you instantly with the color issue: Unlinke the CW3dpgraph, the new parametric 3d graph does offer some nicely defined property notes like an intensity graph, which I really appreciate.
The global minimum and global maximum of the 3d graph's y-matrix
(which is labeld as z in the 3d graph'S rendering ...
could you please label the array constants with their proper name e.g. radius(sound pressure level) ?
So we can better communicate)
´defines the numeric range of "Plots:Surface Color Map" Property.


03-10-2017 05:18 AM - edited 03-10-2017 05:20 AM
- Mark as New
- Bookmark
- Subscribe
- Mute
- Subscribe to RSS Feed
- Permalink
- Report to a Moderator
looks like the y array is displayed on the z axis ... i changed the names accordingly, so s, y and z correspond to array, 3d axis and intensity graph
the zick-zack gap close converge, when we change the divident from 360 to 334 and from 90 to 85 degrees when converting to radians:

03-10-2017 07:36 AM
- Mark as New
- Bookmark
- Subscribe
- Mute
- Subscribe to RSS Feed
- Permalink
- Report to a Moderator
Please forgive me for interjecting and repeating myself ...
In that link I share above you will find links to other threads about 3D graphs. One of those links is a thread where I shared code that produced this image.
And another thread I shared code to help people understand how to organize the data presented to a graph with an example that does this.

I will now step back and thank you for allowing my interruption.
Ben
03-10-2017 06:48 PM
- Mark as New
- Bookmark
- Subscribe
- Mute
- Subscribe to RSS Feed
- Permalink
- Report to a Moderator
I found a couple of issues with my code :
1) I had vertical angles from -pi/2 to pi/2 but that should have been 0 to pi,
2) the divisor for both the horizontal and the vertical angles should be pi when converting to radians.
After fixing the code, the graph looks good now.. however I am still having coloring issues. I want the the colors on the graph to be associated with the sound pressure level(SPL) of the speaker so I attached the SPL values to the color matrix. I do sort of get the colors on the graph that I want but the relationship between the colors and the SPL values is not 1 to 1. because the color mapping is done on the values of axes which goes from -87 to 87 but the SPL values range from 65 to 110.
it would be great to associate a color with the values in the color matrix
03-10-2017 08:24 PM
- Mark as New
- Bookmark
- Subscribe
- Mute
- Subscribe to RSS Feed
- Permalink
- Report to a Moderator
I used the example from Ben's post and used CW Parametric Surface plot as it allows to map the SPL values with the colors.
My only issue with it right now is that I am not able to access the color ramp properties of the graph while the vi is running.
Ben, do you know if it possible to access the color ramp property during run-time?
Thanks!
03-13-2017 07:12 AM
- Mark as New
- Bookmark
- Subscribe
- Mute
- Subscribe to RSS Feed
- Permalink
- Report to a Moderator
The code I included in this thread uses the "W" matrix and maps the values to colors.
Ben
03-14-2017 10:09 AM
- Mark as New
- Bookmark
- Subscribe
- Mute
- Subscribe to RSS Feed
- Permalink
- Report to a Moderator
just for fun,
if we repeat the first column 0 at column 15 in x- y- z-matrix of
, than we can "close" the 3d surface:

