- Subscribe to RSS Feed
- Mark Topic as New
- Mark Topic as Read
- Float this Topic for Current User
- Bookmark
- Subscribe
- Mute
- Printer Friendly Page
Determine Memory Usage
Solved!07-31-2015 09:29 AM
- Mark as New
- Bookmark
- Subscribe
- Mute
- Subscribe to RSS Feed
- Permalink
- Report to a Moderator
Does LabVIEW have the tools available to write a small little script to just run in the background and watch a few applications and processes and report on their memory usage over time?
Solved! Go to Solution.
07-31-2015 09:37 AM - edited 07-31-2015 09:48 AM
- Mark as New
- Bookmark
- Subscribe
- Mute
- Subscribe to RSS Feed
- Permalink
- Report to a Moderator
Here is an example that shows how to get the total processor use.
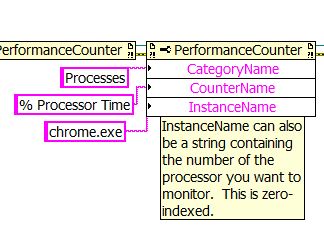
You can change the InstanceName input to match the application you want to monitor.
Edit: I found this other example that actually gives you an interface to plot multiple instances. Though, the instances load as "1", "2", "3", etc. I'm not sure if this is the only way to refer to the instances, maybe someone else on here can give more insight in to this behavior.
Cheers
--------, Unofficial Forum Rules and Guidelines ,--------
'--- >The shortest distance between two nodes is a straight wire> ---'
07-31-2015 10:08 AM
- Mark as New
- Bookmark
- Subscribe
- Mute
- Subscribe to RSS Feed
- Permalink
- Report to a Moderator
Inital trials are producing errors and I'm guessing because my initialization is incorrect in more than one way. These descriptors (CategoryName, CounterName, InstanceName) aren't exaclty telling... at least to someone who's not a .net guy or even a true programmer at that.
07-31-2015 10:10 AM - edited 07-31-2015 10:13 AM
- Mark as New
- Bookmark
- Subscribe
- Mute
- Subscribe to RSS Feed
- Permalink
- Report to a Moderator
I edited my response earlier. See the second link I put in there. Try using "1", "2", etc as the Instance names, though I'm not sure how to link those to specific applications.
See below.
Cheers
--------, Unofficial Forum Rules and Guidelines ,--------
'--- >The shortest distance between two nodes is a straight wire> ---'
07-31-2015 10:13 AM - edited 07-31-2015 10:24 AM
- Mark as New
- Bookmark
- Subscribe
- Mute
- Subscribe to RSS Feed
- Permalink
- Report to a Moderator
Got it! Use "Process" instead of "Processor", "% Processor Time", and "chrome". Should work fine.
The first example I linked to is utilizing the Processor category, which just shows CPU usage by the processor cores. The second example I linked to is great because it shows all of the different categories/counters/instances in an easy user interface. Tinker with that to get the exact instance names you want, etc.
For you, and those who find this thread in the future, here is all of the information in one post.
Monitor total CPU Usage or cores.
UI to browse for all Categories, Counters, and Instances.
Chrome CPU Usage snippet:
Cheers
--------, Unofficial Forum Rules and Guidelines ,--------
'--- >The shortest distance between two nodes is a straight wire> ---'
07-31-2015 10:55 AM
- Mark as New
- Bookmark
- Subscribe
- Mute
- Subscribe to RSS Feed
- Permalink
- Report to a Moderator
Appreicate the help. It looks like there may be a couple bugs in the Performance Monitor.vi It's possible it's a version bug, not sure yet. But I get the idea. Anyways, this should be plenty to kick off with. Thanks!
07-31-2015 11:30 AM
- Mark as New
- Bookmark
- Subscribe
- Mute
- Subscribe to RSS Feed
- Permalink
- Report to a Moderator
Curious, though. What about on a Linux system?
07-31-2015 12:10 PM
- Mark as New
- Bookmark
- Subscribe
- Mute
- Subscribe to RSS Feed
- Permalink
- Report to a Moderator
That, I do not know.
Cheers
--------, Unofficial Forum Rules and Guidelines ,--------
'--- >The shortest distance between two nodes is a straight wire> ---'


