- Subscribe to RSS Feed
- Mark Topic as New
- Mark Topic as Read
- Float this Topic for Current User
- Bookmark
- Subscribe
- Mute
- Printer Friendly Page
Separate Waveform Graphs for Each Analog Input
Solved!11-24-2021 09:33 AM
- Mark as New
- Bookmark
- Subscribe
- Mute
- Subscribe to RSS Feed
- Permalink
- Report to a Moderator
I'd like to measure two external signals (via a single BNC cDAQ module, if that matters) and display them in separate waveform graphs. I've shamelessly ripped my VI from the "Voltage - Continuous Input" example VI, and I'm trying to modify it to accomplish this task. I learned from a YouTube video that I needed to wire one Read VI's Error Out to the other's Error In in order to not throw and error in the while loop. However, it appears that I am throwing an error when attempting to start 2 tasks at once.
I'm still learning how to stand on my own two legs without the DAQ Assistant for the inputs, and I don't fully understand the relationship between the module physically sampling the voltages, the sample clock/timing, and the "task" that needs to run from each VI to the next, so I assume that that is my issue here.
For the why: if you open the VI's front panel, you'll note that I'd like to see each input's waveform on a pretty small waveform graph, and displaying them together on the same graph would get quite busy. I would also like to expand this system to include even more inputs in the future.
I've included an image of the front panel for those who do not wish to download the VI, as well.
In the meantime, my next idea to examine whether I can use the Create VI to sample both channels from the same cDAQ module and split it up in the while loop.
Thank you in advance for any advice!
Solved! Go to Solution.
11-24-2021 09:55 AM
- Mark as New
- Bookmark
- Subscribe
- Mute
- Subscribe to RSS Feed
- Permalink
- Report to a Moderator
Assuming you intend to simultaneously sample two Channels from a single DAQ device, configure your Task to "sample two channels from a single DAQ device", do an "Multi-Channel, Multi-point" DAQmx Read inside the While Loop (specifying an Array of Waveforms provides a very convenient output), then simply take your output (which has a 2 x N Array, assuming you specified two Channels) and, using Index Array, send each Channel to a separate Waveform Chart (or Graph, though I suspect you'll want a Chart).
When I "got started" with DAQmx, I read Learn 10 Functions in NI-DAQmx and Handle 80 Percent of Your Data Acquisition Applications . As a "beginner", I used the "Let MAX help you Create Your Task" method --
- Open MAX, with your DAQ device connected.
- Configure the DAQ Task that you want, including which Channels you want to use, how they are scaled, Sampling Rate, Sample Size, etc.
- Save the Task with a User-Meaningful Name (though I suspect you can't have spaces in the name, something of a pain).
Now you use the "3 DAQmx function" method to build your Acquisition Application.
- Drop down a DAQmx Start Task.
- Right-click the Task Input Connector (upper left corner) and "Create Constant". Right-click the little "triangle" symbol in the (empty) Constant and it should show you Tasks, including the one you just made in MAX. Choose it.
- Drop down a DAQmx Read. Wire it to the Start Task, and draw a While Loop around it (with Start Task outside the Loop).
- Configure the Read for Analog Input (if it isn't already) and N-Channel N-Samples.
- Put any other code you want (like displaying Channel 1 and Channel 2 on separate Waveform Charts). Wire the Stop.
- Drop down a DAQmx Stop Task outside the While Loop and wire it to the Error and Task lines.
- Try it out.
Once you get the hang of it, you can learn a few other DAQmx functions and can skip "hand-coding" the Tasks in MAX (which, of course, only works on the PC that you used to configure the Task).
Bob Schor
11-24-2021 10:04 AM
- Mark as New
- Bookmark
- Subscribe
- Mute
- Subscribe to RSS Feed
- Permalink
- Report to a Moderator
Bob,
Thank you once again for your help, and for the extra details and advice.
For others looking into this issue: as I was pondering the problem I originally posted here, I realized that I might be able sample 2 (or more) signals via the same task. Then in the while loop, it might create a 1D array of waveforms which then could be indexed, each element going to its own graph. After wiring it up, this seems to have solved my problem and I am now getting the desired results (so far). I have attached a screenshot of the block diagram and running front panel for any others who might be searching for a solution to this problem.
Any further critique of this VI is always appreciated!
11-24-2021 11:09 AM
- Mark as New
- Bookmark
- Subscribe
- Mute
- Subscribe to RSS Feed
- Permalink
- Report to a Moderator
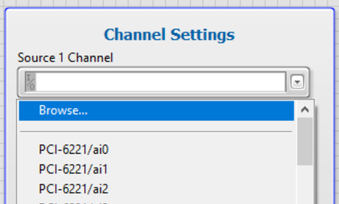
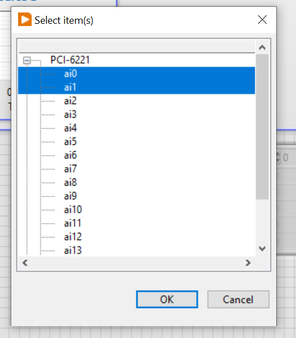
Note: You only need one DAQmx Create Channel vi. The trick is to select two channels(or more) in the physical channel control from the front panel by selecting browse from the down arrow and using CTRL click to select your 2 channels.
11-24-2021 11:18 AM
- Mark as New
- Bookmark
- Subscribe
- Mute
- Subscribe to RSS Feed
- Permalink
- Report to a Moderator
Hi curiositas,
The error is because you are trying to use the same resource, my advice is to use the same source channel but you must select the channels that you are going to use. In this case 2 channels, then in the read output you can select if you want the data as 2D DBL or as 1D array of waveform DBL.
Select browse, then select the channels that you want.

As you can see, now you have two channels in one chart.
After this, you can "play" with the "DAQmx Read" output values and using different charts to show the data. (split the data with the array functions).
06-15-2023 02:52 PM
- Mark as New
- Bookmark
- Subscribe
- Mute
- Subscribe to RSS Feed
- Permalink
- Report to a Moderator
Hi gCarlos,
Need some help to generate 3 sets of 3 phase signals 120 degrees apart. See below table:
| Phase (deg) | |||
| Vline1 | Phase A | ao0 | 0 |
| Phase B | ao1 | 120 | |
| Phase C | ao2 | 240 | |
| Vline2 | Phase D | ao3 | 0 |
| Phase E | ao4 | 120 | |
| Phase F | ao5 | 240 | |
| Cline1 | Phase A | ao6 | 0 |
| Phase B | ao7 | 120 | |
| Phase C | ao8 | 240 | |
| ao9 | |||
| ao10 | |||
| ao11 | |||
| ao12 | |||
| ao13 | |||
| ao14 | |||
| ao15 |
I am using NI 9264 which has 16 channels.
Your help will be highly appreciated.
Thank you!
Richard
06-15-2023 05:15 PM
- Mark as New
- Bookmark
- Subscribe
- Mute
- Subscribe to RSS Feed
- Permalink
- Report to a Moderator
Hey richard.tiatco,
Could you elaborate more the question?
Do you have a code where we can start?
06-16-2023 08:12 AM
- Mark as New
- Bookmark
- Subscribe
- Mute
- Subscribe to RSS Feed
- Permalink
- Report to a Moderator
Hi,
I'm trying to program the NI 9264 and produce the analog voltage output (5 volts amplitude). I also would like to see the waveforms in one chart for the waveforms if possible. I was using the Samples code "Voltage Continuous Output". I really don't need the triggering code part because I will have start button and stop button. The assignment of the code will be based on the table I sent earlier. I also believe I don't need the samples code part because as long as I have the output that is all I need. I will use this program to inject the output to our DSP board for testing purposes.
| Voltage | Phase | NI9264 | Phase (deg) | Voltage Output | Frequency | |||
| Vline1 | Phase A | ao0 | 0 | 5V | 60 Hz | |||
| Phase B | ao1 | 120 | 5V | 60 Hz | ||||
| Phase C | ao2 | 240 | 5V | 60 Hz | ||||
| Phase Neutral | ao3 | 0 | 0V | 60 Hz | This is the return/common | |||
| Vline2 | Phase D | ao4 | 0 | 5V | 60 Hz | |||
| Phase E | ao5 | 120 | 5V | 60 Hz | ||||
| Phase F | ao6 | 240 | 5V | 60 Hz | ||||
| Phase Neutral | ao7 | 0 | 0V | 60 Hz | This is the return/common | |||
| Cline1 | Phase A | ao8 | 0 | 5V | 60 Hz | |||
| Phase B | ao9 | 120 | 5V | 60 Hz | ||||
| Phase C | ao10 | 240 | 5V | 60 Hz | ||||
| Phase Neutral | ao11 | 0 | 0V | 60 Hz | This is the return/common | |||
| Unused | ao12 | |||||||
| Unused | ao13 | |||||||
| Unused | ao14 | |||||||
| Unused | ao15 | |||||||
Please help. Thanks so much!
06-16-2023 08:15 AM
- Mark as New
- Bookmark
- Subscribe
- Mute
- Subscribe to RSS Feed
- Permalink
- Report to a Moderator
Hey, Richard Tiatco,
I see you are a new member of the Forums, and this is only your second Post to the Forums.
It is considered "rude" to hijack a Topic (like "Separate Waveform Graphs for Each Analog Input") by asking another question that is not directly related to the topic under discussion.
Please return to the Forum and on the first page, click the "Start a Topic" button. Give your Topic a title that explains the main problem, then provide as much information as you can about what you are trying to do. If there are data files involved, attach them. If you have code that "doesn't quite work", attach the code. Most of the more experienced Forum users are not using the latest version of LabVIEW, so if you are using the latest (and most LabVIEW beginners will have installed the "current" = latest version, consider "Save for Previous Version" and choose LabVIEW 2019 or 2021.
You should get plenty of "directed" help, with thanks from the Original Poster of this current topic and "Old hands" with the Forum for your courtesy.
Bob Schor
06-16-2023 08:21 AM
- Mark as New
- Bookmark
- Subscribe
- Mute
- Subscribe to RSS Feed
- Permalink
- Report to a Moderator
Hey Bob,
Thanks for your reply.
However I did not mean to be "rude" and I believe you don't need to say that term because I really did not "hijack" the topic. My mistake is I posted on the wrong topic.


