-
Analysis & Computation
297 -
Development & API
2 -
Development Tools
1 -
Execution & Performance
1,003 -
Feed management
1 -
HW Connectivity
112 -
Installation & Upgrade
264 -
Networking Communications
181 -
Package creation
1 -
Package distribution
1 -
Third party integration & APIs
279 -
UI & Usability
5,378 -
VeriStand
1
- New 2,990
- Under Consideration 1
- In Development 1
- In Beta 0
- Declined 2,626
- Duplicate 707
- Completed 327
- Already Implemented 113
- Archived 0
| User | Kudos |
|---|---|
| 2 | |
| 2 | |
| 2 | |
| 2 | |
| 2 |
- Subscribe to RSS Feed
- Mark as New
- Mark as Read
- Bookmark
- Subscribe
- Printer Friendly Page
- Report to a Moderator
Color Shading and Inserting Text to Profile VIs Visually
What bugs me about the VI Profiling Tool is that it is not intuitive. The information it provides is really useful; however, it's so hidden and difficult to interpret that few people actually know where it is to use it. Let's say you are simply acquiring data using DAQmx and writing that data to a file, as below:
You might want to find out how to make this more efficient, but the only way you know is to insert Tick Count VIs and wrap your wires through sequence structures to do it. It's annoying, and there are other ideas from JackDunaway (here) and JohnMc19 (here) which aim to simplify the use of those VIs.
But why re-code your application when the VI Profiler can do it for you? In addition, the VI profiler has more timing information (longest, shortest, average, total, etc) as well of number of runs and memory allocation data.
Good news: VI Profiler makes getting the data easy.
Bad news: VI Profiler makes using the data difficult.
Why Using the Profiler is Difficult
First, you need to know it exists among a number of bland and condensed gray menus (Tools>>Profile>>Performance and Memory).
Next, you have to coordinate starting the profiler with starting your VI (start the Profiler, then start your VI, then stop your VI, then stop the Profiler).
Finally, you have to dig through a TON of VIs to find the ones that are relevant (I assume this is because, for polymorphic VIs, all of the instances are loaded into memory, even the dozens that aren't currently being used.)
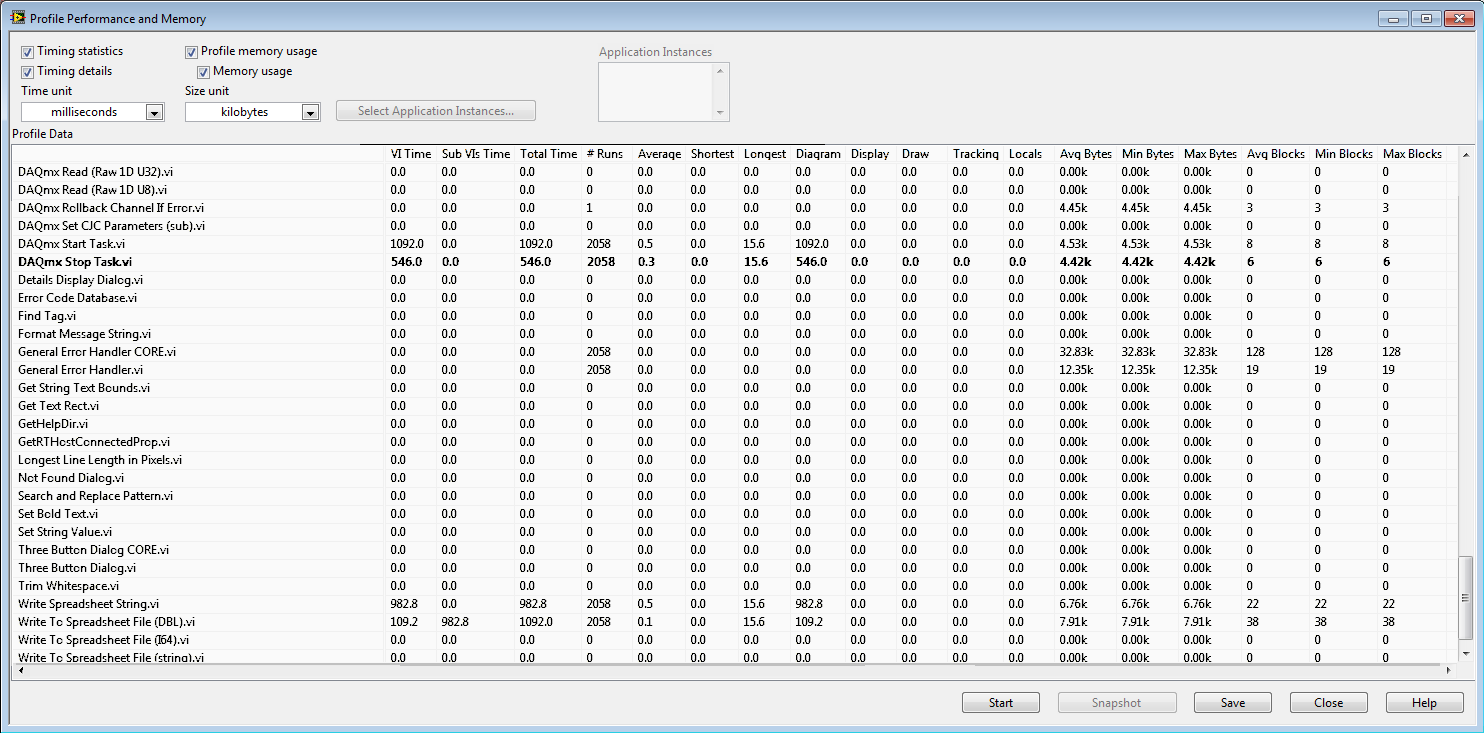
When you find the VI you wish to examine, it will look something like this:
Have fun sorting through that! When I finally find a VI that's hogging memory or speed, I'd expect to click on it to navigate to that VI. NOPE! All the VI Profiler does is make the line bold. Not particularly easy to use...
I can't say if it's possible to get rid of VIs that aren't being used, or to make the menu option more visible to the user, but I do have an idea or two for how to make this information easier to understand in LabVIEW.
So here's what I suggest:
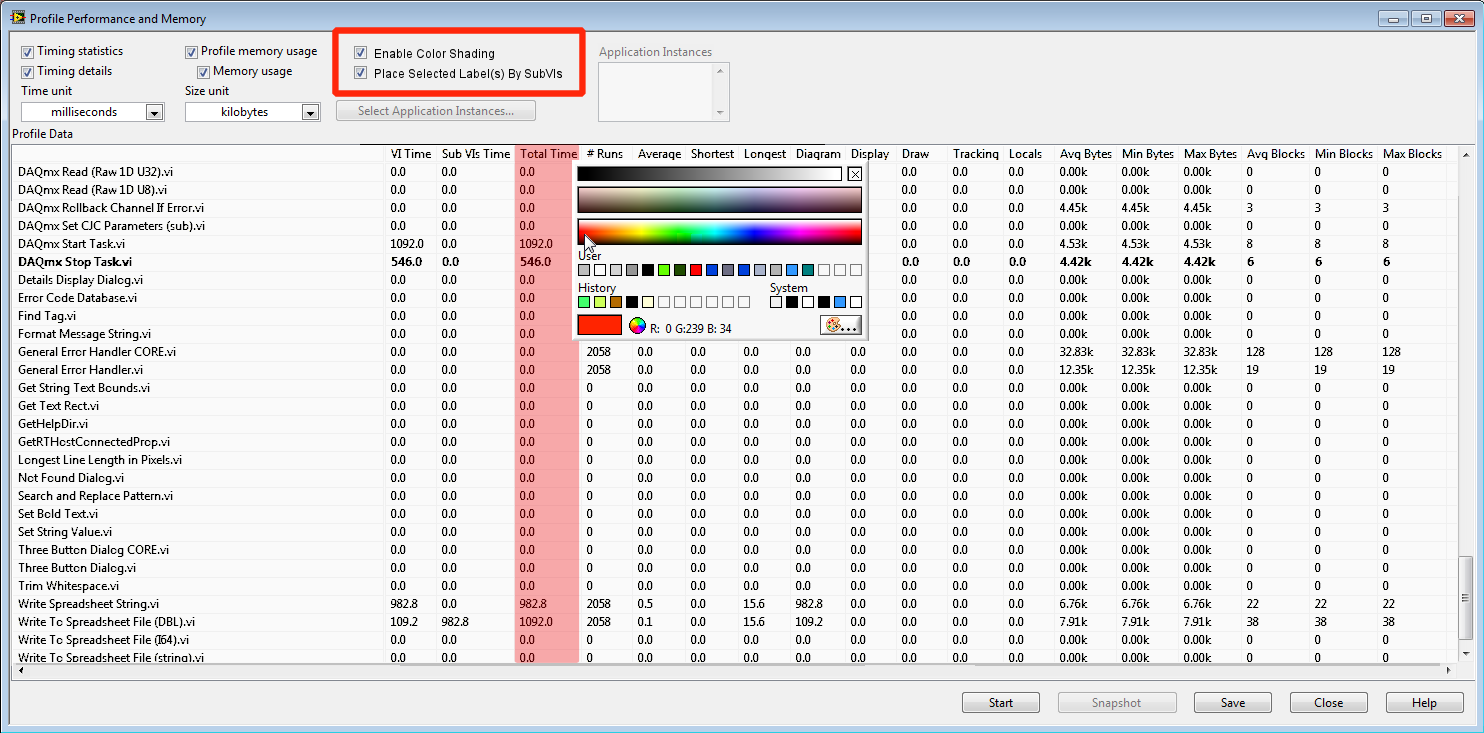
Adding a couple of check-boxes to the top of the VI Profiler will view in relation to your LabVIEW VI. Notice the extra check boxes in the top of this image.
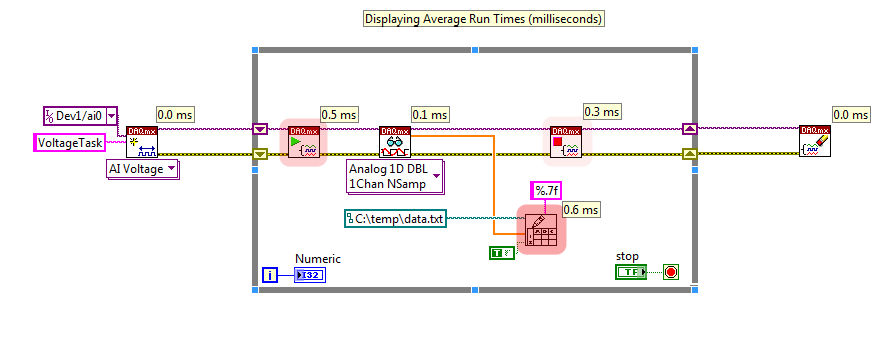
One checkbox allows you to color the column you wish to highlight in your LabVIEW code. The other checkbox inserts a text comment containing the highlighted data straight into you LabVIEW code (right next to the sub VIs):
From the above picture, you can clearly see the Write to Spreadsheet File VI is the slowest to execute. Next in line are the Start DAQmx Task VI and then the Stop DAQmx Task VI. So if a developer wanted to find out how to make his loop run faster (and therefore increase the rate data is read from his PC RAM), he would know the VIs that are more red are the ones he needs to focus on first.
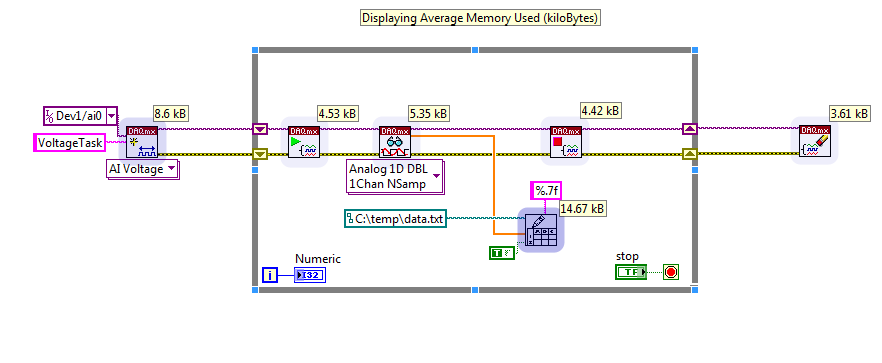
Also, if a user wants to highlight the memory usage, he could select a memory column from the VI Profiler.
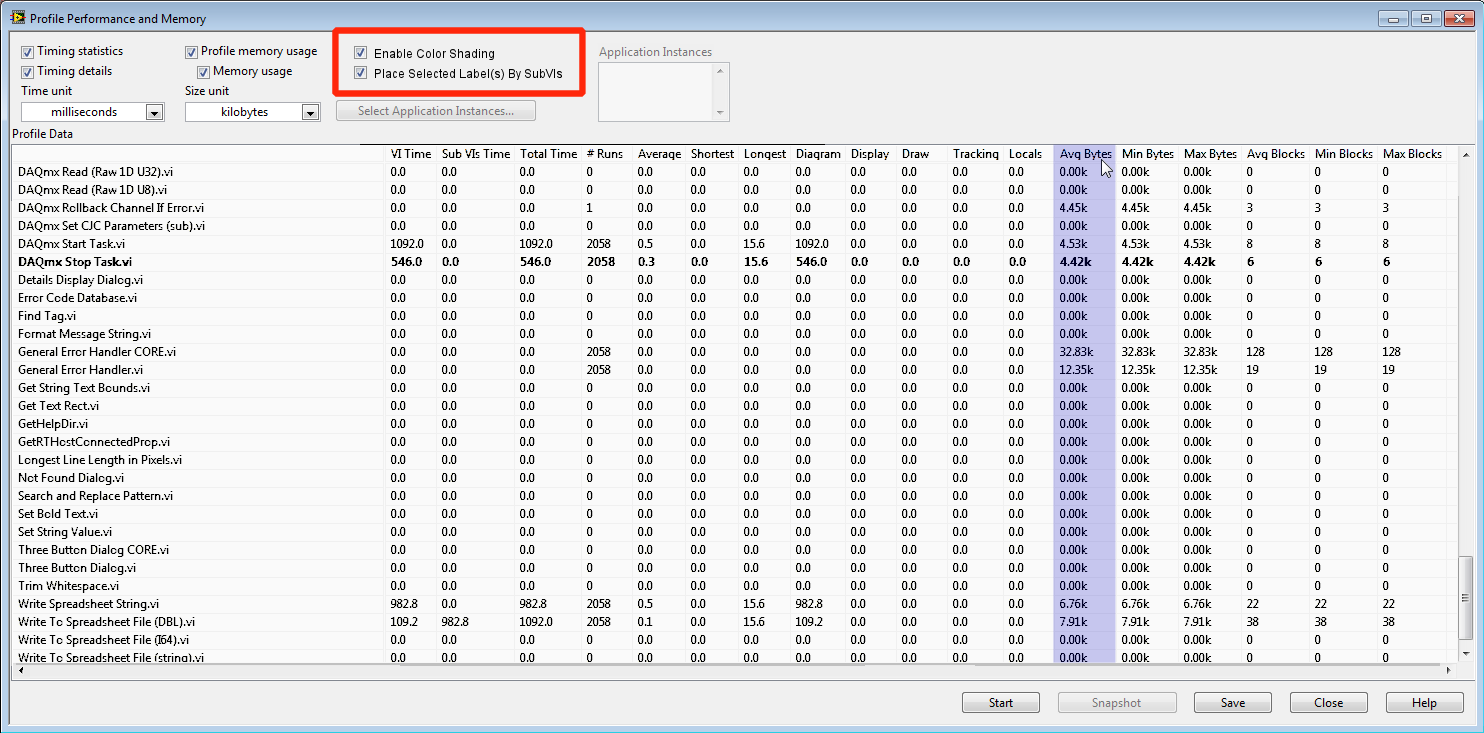
Then the LabVIEW block diagram would look like this:
In this case, if a developer wants to find out how he can optimize his code for memory usage, he knows where to start.
Side-note: I think selecting multiple colors at a time (one for each column of data you wish to highlight) would be cool, but that would start to get messy on the block diagram.
Other data, like the number of runs, could highlight which sections of code are running more often than others.
If we integrate the VI profiler more effectively into LabVIEW, there are a lot of benefits:
1. Re-coding to find timing specs won't be necessary for Sub-VIs
2. Monitoring memory allocations much easier (some users don't know it's possible with LabVIEW).
3. When there's a problem, it's easier to understand which SubVIs are slowing down code or hogging their memory.
4. Developers can further code development WHILE being wary of inefficiencies.
5. More integrated development environment "feel" for new customers or the experienced G-coder.
Please let me know what you think!
You must be a registered user to add a comment. If you've already registered, sign in. Otherwise, register and sign in.

