-
Analysis & Computation
301 -
Development & API
2 -
Development Tools
1 -
Execution & Performance
1,004 -
Feed management
1 -
HW Connectivity
113 -
Installation & Upgrade
264 -
Networking Communications
181 -
Package creation
1 -
Package distribution
1 -
Third party integration & APIs
280 -
UI & Usability
5,387 -
VeriStand
1
- New 2,988
- Under Consideration 11
- In Development 1
- In Beta 0
- Declined 2,628
- Duplicate 708
- Completed 329
- Already Implemented 114
- Archived 0
- Subscribe to RSS Feed
- Mark as New
- Mark as Read
- Bookmark
- Subscribe
- Printer Friendly Page
- Report to a Moderator
Need a way to visualize VI call chain hierarchy
Problem Statement
I often find myself debugging code that seems to have "hangged" and I want to find out which VI is causing the "hang" (maybe it's waiting on some event/queue/message/timeout or maybe it's stuck in an infinite/long loop). There's no really easy way to figure out which subVI (or perhaps a node) is not returning from its call.
My Work-Around
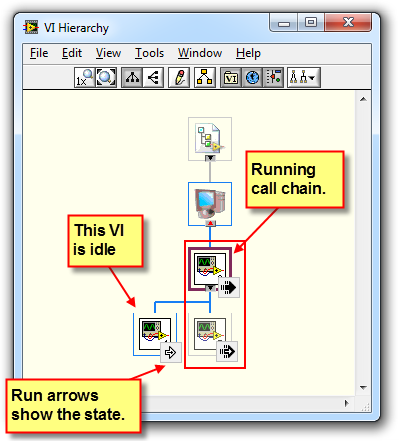
The way that I currently do this is to start opening up VIs and looking at their "Run Arrows" (the run buttons on the VI toolbar) to see which subVIs are currently "running" (being called).
Running (Top-Level VI)
Running (Sub-VI of a Running Top-Level VI)

Not Running (Sub-VI of a Running Top-Level VI)
This technique works OK, but it takes a lot of time to track down the running VI (in applications where there are LOTS of VIs), since you have to just start opening up all your VIs a looking at their run arrows.
Question: Is there any way to look at the run state of a VI using VI Server or Scripting? Unfortunately, the VI Execution.State property is "Running" for all three states shown/illustrated above (the "Idle" state is for VIs that are not reserved for execution, meaning they are not in the hierarchy of a running top-level VI). Maybe I'd also add to my feature request that it would be nice if there were a way to interrogate this state using VI Server or Scripting.
Possible Solution(s)
What would be nicer is if I could ask LabVIEW to Find all Running SubVIs/Nodes and visualize them by their VI Hierarchy. Maybe we could have an option to show the run state in the VI Hierarchy window. And, maybe there could be a way to only show running VIs (hide all Not Running / Idle VIs).
Now, I realize that the VI hierarchy window doesn't have any way to visualize multiple subVI "instances" of a VI, but maybe that could be an option as well (Show all SubVI instances. Also, it would be cool if we could show "Clone" instances of reentrant VIs... but, I digress.
Also, the VI hierarchy window only shows VIs, it doesn't show nodes/functions that might be running (and what's causing my code to "hang"). It might be nice if we could also include nodes, at least for the purpose of helping me find out which nodes are running.
So, I'll end by just stating that I need some easier way to figure out why my application appears to have hung and I hope that this "Idea" leads to more discussion and maybe some more features in LabVIEW to help me debug and visualize my applications.
Do you have any ideas for how to better debug applications that appear to have hung? Do you have ideas for new LabVIEW features that could help?
Thanks!
You must be a registered user to add a comment. If you've already registered, sign in. Otherwise, register and sign in.


