View Ideas...
Labels
-
Analysis & Computation
297 -
Development & API
2 -
Development Tools
1 -
Execution & Performance
1,003 -
Feed management
1 -
HW Connectivity
112 -
Installation & Upgrade
264 -
Networking Communications
181 -
Package creation
1 -
Package distribution
1 -
Third party integration & APIs
278 -
UI & Usability
5,374 -
VeriStand
1
Idea Statuses
- New 2,988
- Under Consideration 1
- In Development 3
- In Beta 0
- Declined 2,626
- Duplicate 705
- Completed 324
- Already Implemented 113
- Archived 0
Turn on suggestions
Auto-suggest helps you quickly narrow down your search results by suggesting possible matches as you type.
Showing results for
Options
- Subscribe to RSS Feed
- Mark as New
- Mark as Read
- Bookmark
- Subscribe
- Printer Friendly Page
- Report to a Moderator
View probe values within the code during execution
Submitted by
 Citabria
on
10-06-2011
11:11 AM
19 Comments (19 New)
Status:
New
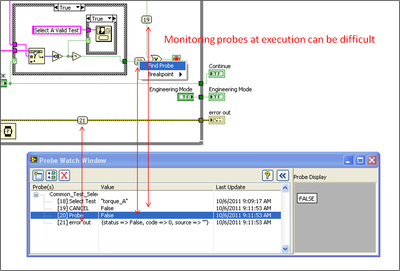
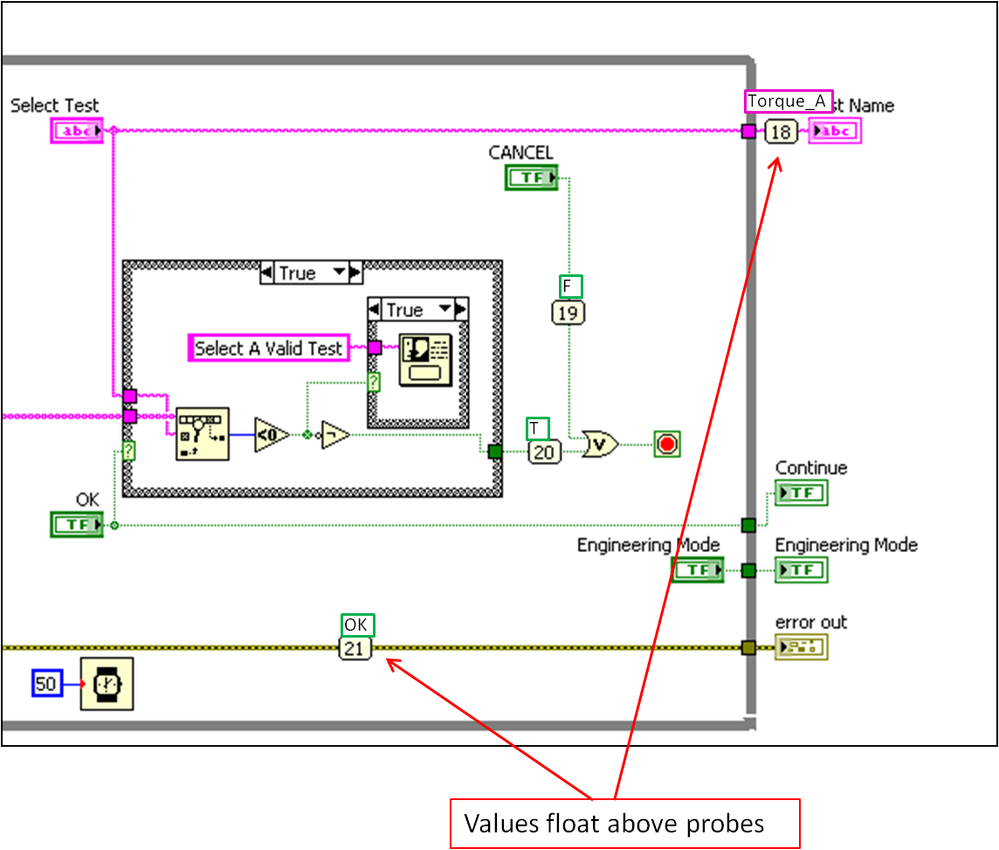
Probes are so useful for debugging, but monitoring them within the Probe Watch window can be a headache. I constantly find myself focusing back and fourth between Probe Watch and the code to translate a probe number to a position in the code. A solution would be to have the probe's value float just above the probe itself. LabVIEW already has a similar feature. When you use Highligh Execution wire paths display their current vaules, but using Highlight Execution is too slow and no practical for every debug situation.
Here is the issue as it stands today:
Here is my proposed new feature! :
Labels:
19 Comments
You must be a registered user to add a comment. If you've already registered, sign in. Otherwise, register and sign in.


